I’ve got a real problem with the term sales funnel.
Ask yourself, what does a funnel do? It re-directs all fluid from the source into a container. Now, I don’t want to be that guy, but I’m yet to come across a sales funnel that directs all traffic from source to your checkout, let alone converting them all into paying customers! Let’s be honest here, all sales funnels leak prospects, and I’m glad they do, if they didn’t, I’d be out of a job!
I know I’m being pedantic and that we’re using the verb form of funnel meaning to direct prospects through your sales process. What’s most important here though is that sales funnels leak. They all do. Some leak a lot while others only a little.
Losing a certain percentage of your prospects throughout your sales funnel is a fact of life for a marketer. You’re never going to convert 100% of the traffic that comes to your website. However, that’s not to say you should be happy with the current percentage of prospects you’re losing through funnel leaks.

Photo credit: Deathtostock
Whilst your funnel is always going to lose a few prospects, there’s nothing to say that you can’t plug those holes and drastically reduce the number of leads you lose at every stage.
Of course, the first step in plugging those holes is finding them. With that being said, let’s take a look at a quick and easy method for you to identify the key areas of your funnel that are losing prospects and zero in on their cause.
Start By Visualizing your Funnel
Before you start digging into your data, you need a visual representation of your funnel. It sounds like a rudimentary step but creating a visual plan to work from offers two primary benefits:
- It clarifies the distinct phases of your funnel
- Adding drop off rates and percentages to a visual depiction makes identifying problem areas extremely easy
How you choose to design your funnel representation is up to you. If you’re reading this, you’ve likely seen hundreds of funnel visualizations and don’t need me telling you what works well.
However, I will outline a few key design ideas that make identifying key areas for improvement far easier:
- Include lots of information
- Yes, you’re trying to make the process simpler, but if you can create a comprehensive funnel representation, it will act as a hub of sorts. A one-stop shop for you to find problem areas and understand what causes them.
- Use of Colors
- Just like Google Analytics’s flow diagrams, use colors to represent better the actions your prospects take. Red for an exit, green for a progression.
- Condense it down to the bare essentials
- Include the information that’s pertinent to the process, but don’t get overly wordy. Try to sum up problems and causes in as few words as possible for ease of reference later on.
These are the key elements I use when drawing out the stages of a funnel and populating it with the relevant information. You’re aiming for a comprehensive yet simple illustration of your funnel, just like the below.
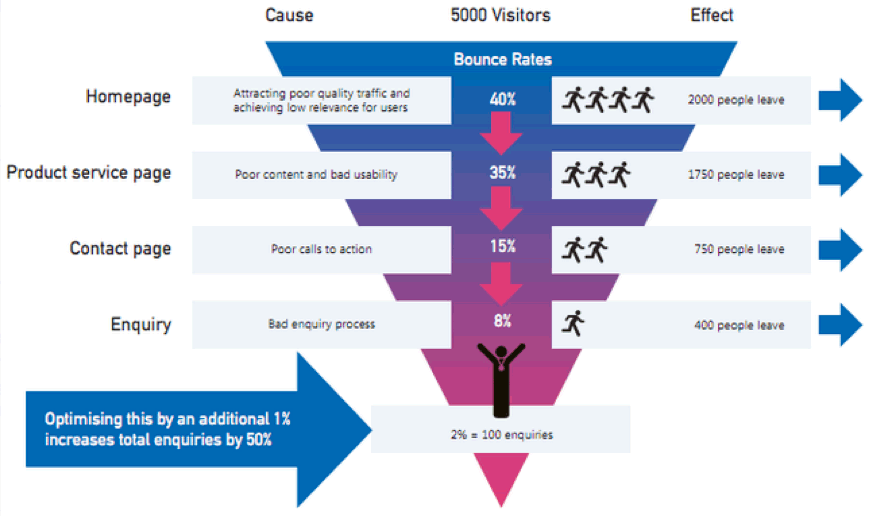
Image credit: Coast Digital
The above example from Coast Digital is an excellent example of the kind of funnel visualization I love. Not only is it easy to identify the key stages of the funnel but you’re given ample room to write details on cause and effect at each stage. Whoever designed this funnel has also made sure to limit the complexity with which problems are explained so you can get to the heart of the matter in seconds.
It’s a great example of keeping it comprehensive yet simple.
At this stage, all you’ll need to include are then basic stages of your funnel. Next up is identifying what’s happening at each stage and using the information to populate your visual funnel.
Identify Key Drop Off Points
There are quite a few notable tools to help better understand your sales funnel. The two primary contenders in this sphere are Moz Analytics and Google Analytics.
For this particular process, I’ll be focusing on Google Analytics (GA) as it’s a free service everyone will have access to and, in all honesty should have already set up.
You’ll likely already have Analytics tracking the key metrics of your site. However, there’s a surprising number of marketers out there who haven’t taken the time to set up their funnel properly. Here’s a quick and dirty guide to setting up a funnel in GA.
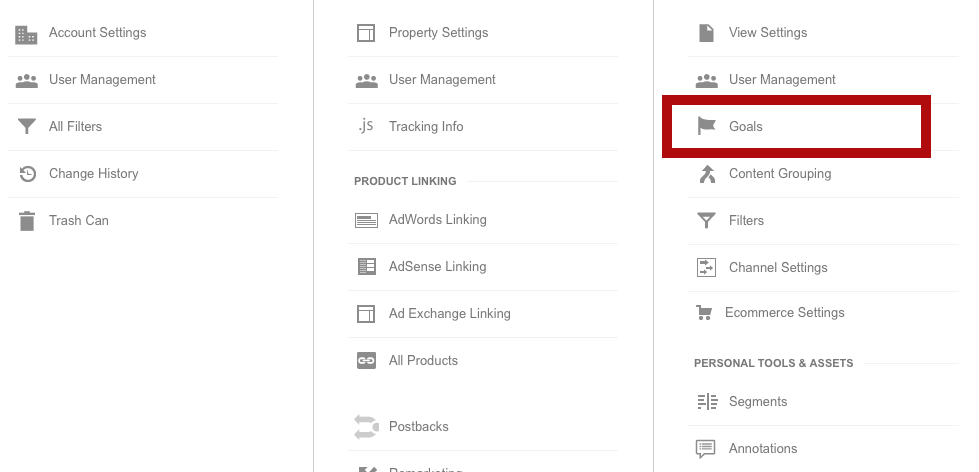
The first step is to head to your GA dashboard and click on the Admin button. Once there, you want to click on the Goals tab.
From your visualization earlier you should already know what the desired end action is. Follow the on screen prompts to create a new goal and name it according to your funnel end goal i.e. New Subscribers, Purchase Made, etc.
Continue to follow the on-screen prompts to set up your goal until you reach the below screen.
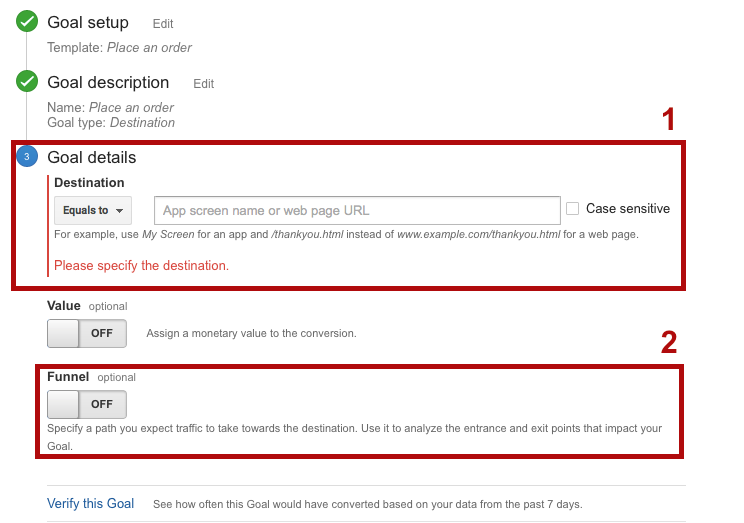
In box one, you want to put the URL of the page that signifies the goal has been completed, for example when tracking my subscriber rates my end goal is the URL /thanks-for-subscribing.
That’s enough to track end goal conversions, but we want a full funnel breakdown. Something that the user flow data from the main dashboard just doesn’t supply.
To get this full funnel breakdown, you need to activate the option in box two, funnel tracking. After activating this, you’ll be able to add the various stages of your funnel that will, after acquiring enough data, give you a more comprehensive understanding of user behavior and drop off rates.
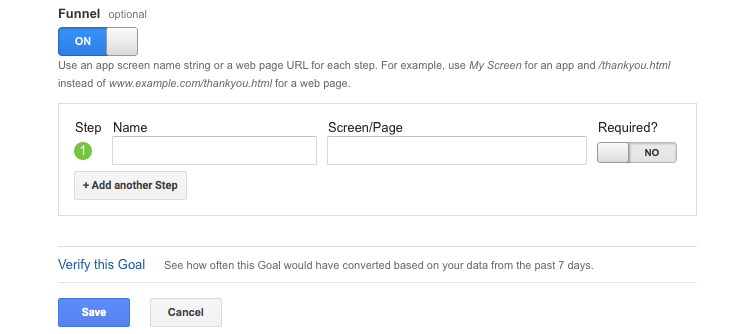
Fill in the various stages of your funnel and add the URLs that represent that stage. If I remember correctly, you can track up to 20 funnel stages that should be more than enough for the majority of needs.
Once your profile has had a little time to collect the data you can head to Conversions > Goals > Funnel Visualization to see something that looks like the below.
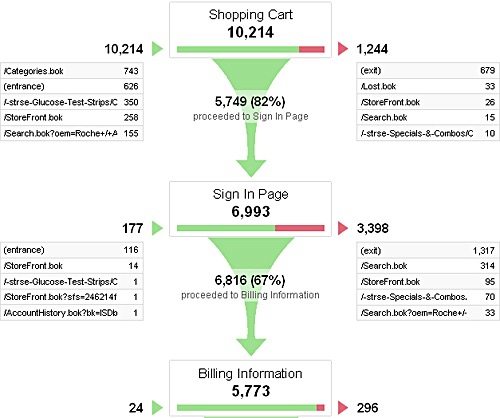
Image credit: morevisibility
This is the start of the data you’ll need for your funnel visualization. Copy over the various statistics including drop off and progression rates for each stage in your funnel.
If I had to give a tip here, I’d recommend that you focus on the percentages in your visualization. Knowing that your users dropped from 10,214 to 6,993 between stage one and two are important. But knowing that 6,993 represents 67% of your users is far easier to understand.
Should You Just Jump At the Lowest Converting Stage?
Until this point, it’s all been pretty much business as usual. However, here’s where we kick it into overdrive and start with the conversion tactics.
Let’s imagine that the below is true for your funnel and represents the data you’ve input into your visualization.
| Stage | Visitors | Conversion Percentages |
| 1 – Homepage | 1,000 | 15% |
| 2 – Email Signup | 150 | 30% |
| 3 – Product Page | 45 | 60% |
| 4 – Purchase | 27 | 50% |
In the above sales funnel we see that 1,000 visitors converts into 13.5 customers (we’ll say 14 for argument’s sake). What you need to figure out is which stage will gain the greatest gain in paying customers.
A lot of the advice out there will advise you to jump straight in at the lowest converting stage. It’s not bad advice, after all, the lowest converting stages are usually the easiest to fix. However, don’t just jump at the easy wins, see a minor increase in microconversions and call it a day.
Sure increasing that 15% to 20% for stage one to two is an easy win, but you need to monitor what that does to your end goal.
Let’s imagine that you’ve optimized your landing page and seen an increase to 20%. This 20% turns out to be a different crowd from your initial 15% of converters. However, despite being a different crowd you’ve maintained the same conversion rates at every other stage.
You’ve seen the microconversion increase and think it’s a done deal. You’ve achieved the impossible and increased customer numbers. But wait… somehow, your overall revenue has dropped. Why?
Well, in optimizing your homepage you’ve managed to attract a crowd of prospects who pull in a much lower AOV. The initial funnel’s 14 customers had an AOV of $50 totaling $700. However, the AOV of the 18 customers from optimizing your funnel is only $25 which totals $450. You’ve traded more customers for a lower value.
Starting at the lowest converting stages of your funnel is the go-to method for the majority of marketers out there. Often this tactic works out just fine, however, don’t think that an increase in microconversions means your campaign’s been a success. If your microconversion increase lowers your macro conversion rates or overall revenue, then it’s detrimental to your business and needs to be rectified.
Identifying the Real Easy Wins
Once you’ve zeroed in on the lowest converting stage, it’s time to figure out the problem. This is going to round out the data for your visualization and make finding the overall easiest task a cinch.
To start with you want to dig into your Analytics data. If you followed the steps earlier, you should be able to break down the conversion goal flow by various demographic data.
Examine the various stages of your funnel and check the conversion rates for the below segments to identify patterns or potential problems.
- Browser
- Are Firefox users converting less than Chrome? If so, download Firefox and scour the drop-off point for errors that could be caused by poor browser optimization.
- Do the same for different devices and browser combinations.
- Demographics
- Do men convert better than women? Is there a certain age group that converts very poorly? Look into what could be causing this. Key offenders could be design, copy and a lack of clarity across age groups/genders.
- Source
- Check both on-site sources and off-site sources.
- The first thing to check is on-site. Does a particular start point yield a higher overall conversion? Compare it tot he lesser converting pages to figure out potential reasons why
- Does traffic from referral source one convert better than referral source two and organic search? Check out the source and see what it is that makes your funnel less relevant to that segment of traffic.
- New Vs Returning
- Generally speaking, there’ll always be a disparity between new and returning visitor conversions. Sales are made on trust and trust takes time to build. However, if new customers aren’t converting at all, it’s likely because your site isn’t well optimized for the new visitor. Look at how you can streamline the biggest problem areas for new users.
This is the data that fills out the cause section of your funnel. Knowing the cause will help you identify the easy fixes.
However, sometimes there’s no difference you’ll look into your data and see that conversions are poor across all demographics, browsers and sources. If that’s the case, the problem is likely with your copy or lack of understanding your audience.
Do a little research on what makes a compelling headline, how to write persuasive copy and the secrets to CTAs that convert. Research your audience and competitors to make everything on your site more relevant to your audience’s needs. This should help raise conversions that are low across the board.
Conclusion
Sales funnels can be tricky to optimize. The key to plugging any leaks is to take a methodical approach to their identification and ultimate resolution. If you overlook any of the key stages in this process, you’ll find out the hard way how even a minor issue can cause major problems and huge amounts in lost revenue.
Your absolute priority through should always be to monitor the macro conversion. All the changes in the world and an increase in minor stages count for nought if your overall revenue is dropping.
Before you hit that share button and think on this topic, remember that funnel optimization and data collection isn’t retroactive. If you want to see good gains and stop the leaks in your funnel, you need to get started now. No more wasting time thinking or planning, draw up your visualization and set up your funnel to properly populate it with data before the end of the day.