You’re never going to grow your online business and improve conversions unless you use analytics. Back in the old days, the owner of a mom-and-pop store knew who was coming through the door, who’d sent them, what products were shifting and when to reorder. That’s what analytics tells you – and more – for an online ecommerce business or website. It can help increase conversions and website sales. While there are plenty of analytics tools, Google Analytics is one of the most widely used. More than likely you already have it installed on your site. The Google Analytics dashboard is divided into four sections: audience, traffic sources,content and conversions – let’s look at the information you get from each of these and how that can help you.

Audience
1. Who are you and where do you come from?
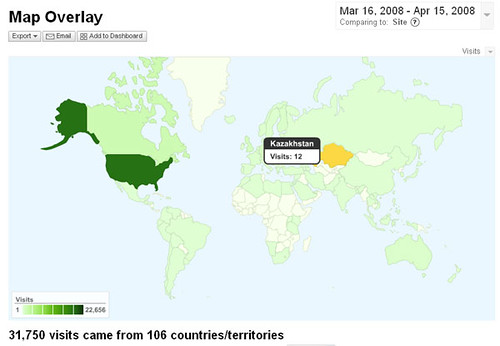
The audience section gives you a complete picture of the people who visit your site, starting with which countries they are from and what languages they speak (that’s in the demographics sub-section). You can even drill down into the cities in some cases. For example, if you suddenly notice that you have a lot of Spanish speaking visitors, that could mean you need to provide on-site translation tools or a version of the site in that language. Catering for your whole audience helps with conversions.
2. Do you like my site?
The visitor behavior sub-section tells you whether your visitors are new or have been before, how often they visit and how long they stick around. Looking at these metrics tells you whether you have what is known as sticky content that provide value for visitors – if you don’t then it’s time to get some. That’s because the longer people stay on your site, the more likely they are to complete the desired action. More visitors, staying longer = better website conversions. Check out the bounce rate in the audience overview for more background on this. A high one means that something on your site is turning visitors off, so you need to troubleshoot that and eliminate the error. There are several tools to help you to do this.
3. What technology are you using to browse my site?
Technology is changing all the time. Looking at this part of the report helps you keep a handle on what tech your visitors are using. This has implications for everything from landing page design to behind the scenes web design wizardry that makes visiting your site better and improves usability. For example, if your site visitors are using an outdated version of Internet Explorer then you know some of your bells and whistles just won’t display. At the other end of the scale, if your visitors are using smartphones and tablets, it could be time to consider a responsive or adaptive site and content designed specifically for mobile.
Traffic Sources
4. How did you find my site?
The traffic sources report in Google Analytics gives you a broad overview of how people are finding your site and you can drill down for more detail. It’s a great place to find out:
- whether people know about your site and have bookmarked it as a destination for useful information (direct traffic).
- whether other people see your site as an authority and quote you, sending traffic your way (referral traffic).
- whether your guest posting campaigns or appearances as an expert source are paying off (referral traffic).
- whether your web optimization efforts are working (search traffic and the SEO report).
- if your paid search campaigns are having the effect you want. (There’s a sub-section just for Adwords, too.)
You can also drill down into search traffic and see exactly what people are searching for on your site. If there’s something they’re looking for that’s not there, that could guide your content creation efforts.
5. What social media sites are you using?
Social media usage is increasing and one of the biggest recent improvements in Google Analytics looks deeper into social media metrics. In the social media sub-section you can:
- see which pages are attracting interest on social media.
- monitor trackbacks to see who’s linking to you and how.
- find out which sites visitors are using to share your content.
Sometimes you might get a surprise, like finding out that your visitors are sharing on social sites you have completely ignored. That’s a sign that you should put the right social sharing buttons on your site to increase the chances of social sharing. And maybe you should have a presence there to send people back to optimized landing pages on your site and achieve better conversions. Another interesting part of this report is the social visitor flow which tracks how people move through your site before they share. Again, this data can help with conversion optimization efforts.
Content
6. What do you do when you’re on my site?
Similar to the social visitor flow, the behavior flow report tracks visitor behavior from entrance to exit. You can customize the level of detail. Being able to see how visitors behave as they land on a page, follow a link to another page, move deeper into your site or abandon it altogether. That can help you decide which pages simply aren’t working and which to optimize so it’s a useful tool for improving your site.
7. Which pages do you like best?
There are lots of ways of looking at content in this sub-section of the analytics report, so you can find out:
- which URLs are attracting visitors.
- what the page titles are (if there’s a common factor it tells you what your strengths are).
- which pages sending people away (either because they have successfully done what they want or because they haven’t found the information they need).
- what percentage of visitors found your site via search and what terms they used to find it (another pointer to possible optimization needs).
- how fast your site is (an important metric for SEO).
- how your pages correspond to Adsense revenue.
Conversions
8. Is my site working for you – and for me?
In the conversions section, there are sub-sections for goals, ecommerce, multi-channel funnels and attribution. In order to get any useful data you’ll have to set this up, but once it’s done you can learn whether your conversion optimization efforts are working. You can find out:
- if visitors to your site are signing up for your email list.
- whether they have downloaded your free resource.
- if they have visited your online store and whether they have bought anything.
This section puts everything together so you have an overall view of the success of your site from a visitor point of view and can see how visitors move through your site content to achieve their goals and yours.
This is just an overview of what analytics data can help you with. For more on this, check out this excellent analytics resources guide on Kissmetrics.