How to Build a Culture of Experimentation That Doesn’t Fall Apart When People Leave
Let’s be honest: most experiments won’t “win.”
And that’s fine—because the real goal of enterprise experimentation isn’t a single A/B test. It’s building a system that consistently delivers insights, revenue, and resilience across teams.
In Part 2 of our latest podcast episode, Arun and David dig into what separates long-term experimentation success from short-term sparks that fizzle out when a single stakeholder leaves.
Here’s what we covered:
1. Wins Are the Fuel, But Culture Is the Engine
A few successful tests aren’t enough. If your entire experimentation program lives in one person’s head—or one team’s Google Drive—it won’t survive when that person leaves.
To scale this capability, enterprise orgs need:
- Cross-functional teams that can act independently
- Visibility into what’s being tested and what’s been learned
- A center of excellence (not a patchwork of BU experiments with zero ownership)
Make experimentation a strategic asset, not a side project.
2. Start Small. Share Loudly.
Early wins matter—but so does how you socialize them.
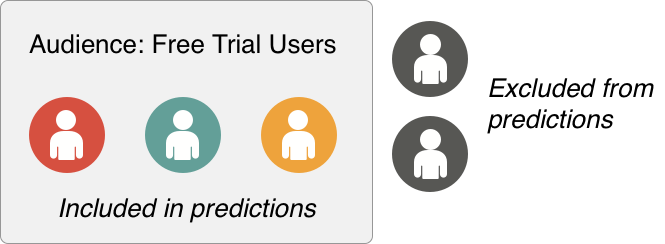
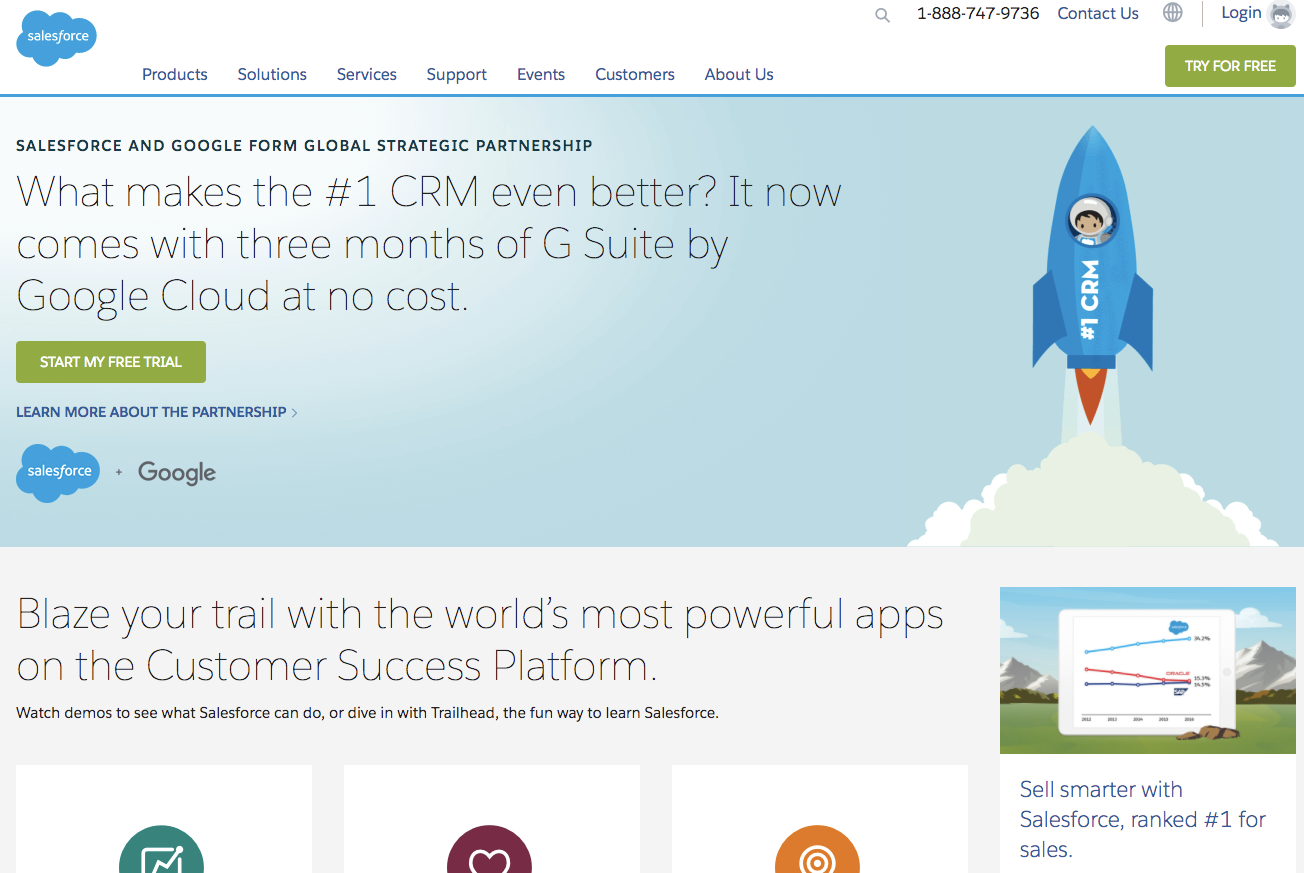
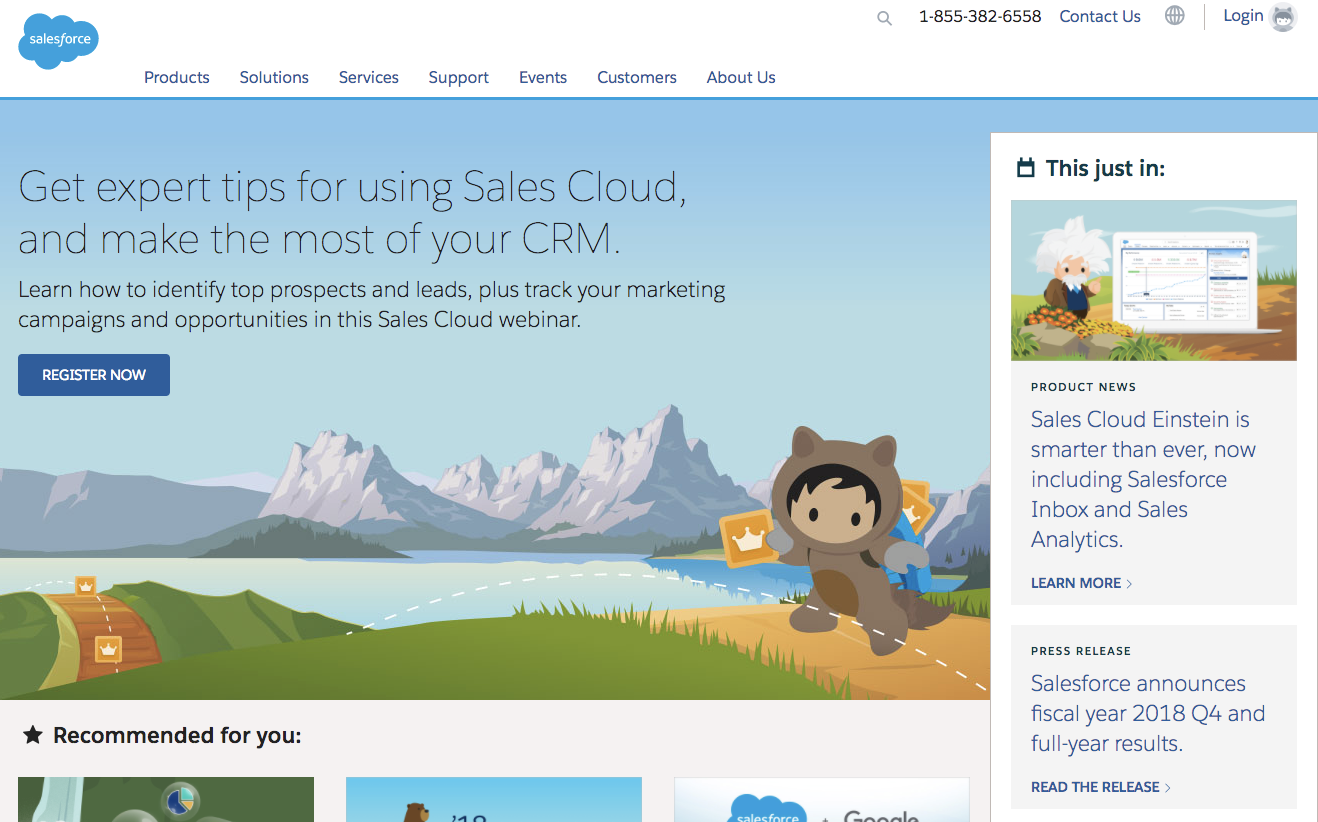
Even if the first tests are on small, low-friction areas (like lead forms or paid landing pages), the learnings often apply far beyond that single channel. Those insights should be shared across the org, through:
- Internal newsletters
- Experimentation decks
- Customer insight docs
- Team-wide playbooks
This is how you earn buy-in before the next budgeting cycle.
3. Build a Team That Can Ship
If your experimentation team needs to ask 10 people for permission to test a button color—you’re dead in the water.
What works better:
- An agile squad with analytics, dev, QA, and strategy in-house
- Empowered autonomy from slow-moving parts of the org
- A governance model with lightweight approvals and tight feedback loops
Don’t overthink it. Don’t wait for perfect data. Start testing, start sharing, and build from there.
4. Avoid the Trap: Complexity ≠ Maturity
Too many teams over-complicate experimentation with heavy processes and endless planning.
Here’s the play:
- Start where you’ll see quick wins and minimal stakeholder blockers.
- Share those results widely and often.
- Build a center of excellence that spans orgs and departments.
And most importantly—don’t wait for perfect tracking. You don’t need flawless data to ship meaningful experiments. You need trust, velocity, and a tolerance for smart, managed risk.
Watch the full conversation on building enterprise-grade experimentation programs
Get Done-for-You Custom Lead Gen Forms
High-converting, multi-step, intelligent forms that do the heavy lifting for your sales team. Built in 30 days.
Want help building your culture of experimentation?
Let’s talk. We’ve done this for orgs just like yours.
Book a Call with FunnelEnvy