The tools that Optimizely gives you out of the box are excellent for lead gen or e-commerce sites. And while conversion metrics can and should be used for media sites, more often than not you’ll also want to be able to track the effect of any given experiment on pages per session.
The problem is that Optimizely, in most cases, will only let you track differences in whether or not a single event happened — a conversion. Optimizely also has built-in support for tracking the difference in revenue per visitor, but not for the difference in the average of any other metric that you might be interested in.
For the purposes of this post, I’ll be writing about how to get around that specifically for pages per session, but this can be used for any metric that can be tracked in Google Analytics.
Tracking Pages Per Session in Google Analytics
To get started, we’ll need to start tracking pages per session as a dimension in GA. Google Analytics will already track Pages Per Session as a metric, but since we’ll need the distribution in order to perform the analysis of the data we’ll need to track it as a dimension.
First, we need to create the dimension in GA.
Open up your Google Analytics account and click on the admin section.

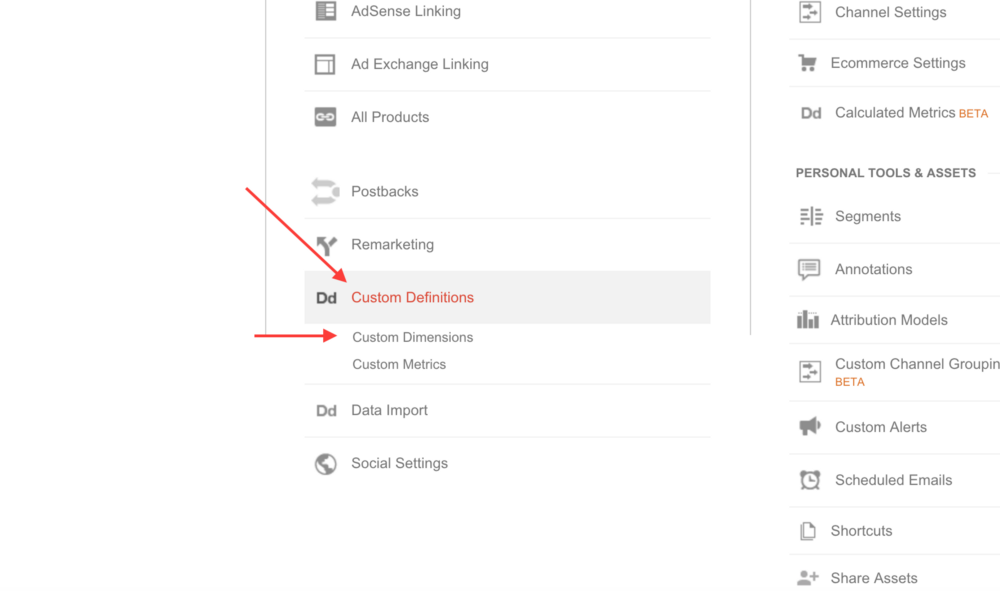
Next, go the “Property” panel and click on “Custom Definitions” then “Custom Dimensions.”
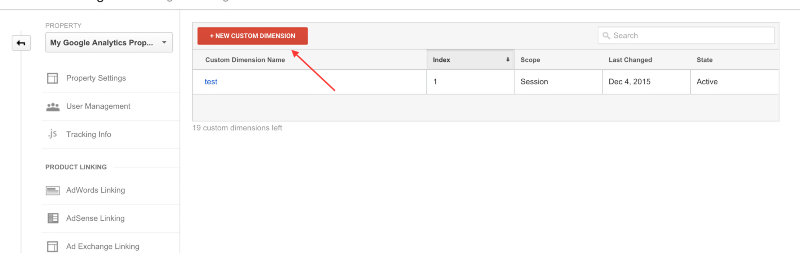
Click the “+ New Custom Dimension” button.
You can name the dimension whatever you like but for our purposes, we’ll call it “Pages Per Session.” Make sure to set the scope to “Session.”
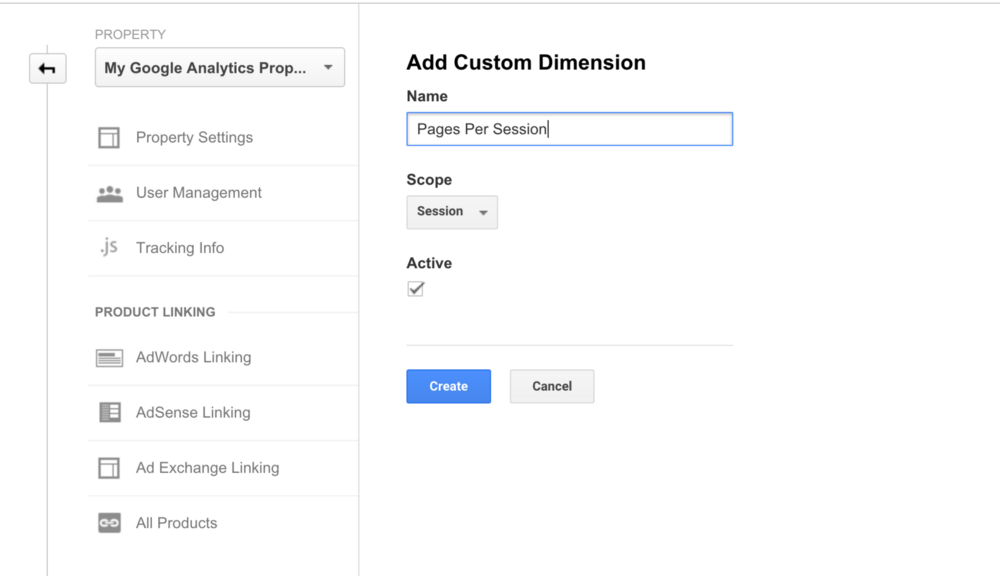
Click “Create” and your pages per session dimension will be ready to go.
If you haven’t done so already, you can also take this opportunity to set up your Optimizely + Google Analytics integration which will also require setting up a custom dimension.
This part will require a bit of JavaScript. You can deliver this code using theOptimizely Project Javascript if you have that available, otherwise you can use Google Tag Manager or place the code directly on your site.
Here’s the tracking snippet:
![]()
This code will create a cookie that counts the number of pages that every visitor to your site looks at and sets the number as the users’ Pages Per Session dimension. In Google Analytics, this will mean that the value of this dimension for each user will end up being the number of pages that they saw before leaving.
Once all of this is in place you’re ready to start your experiment. Make sure that you enable the Google Analytics integration for the experiment.
Analyzing The Experiment Results
Now that your experiment is tracking in Google Analytics, you can run an analysis of the data by creating a custom report and using the FunnelEnvy pages per session t-test calculator. The Google Analytics report will provide us with the number of sessions for each pages per session bucket for each variation. This is important because it allows us to get a distribution of pages per session rather than just an average. In order to do a statistical analysis of both variations you will need to calculate this distribution. Our calculator takes a lot of the work out of this by calculating everything and placing it into the t-test calculator on evanmller.org.
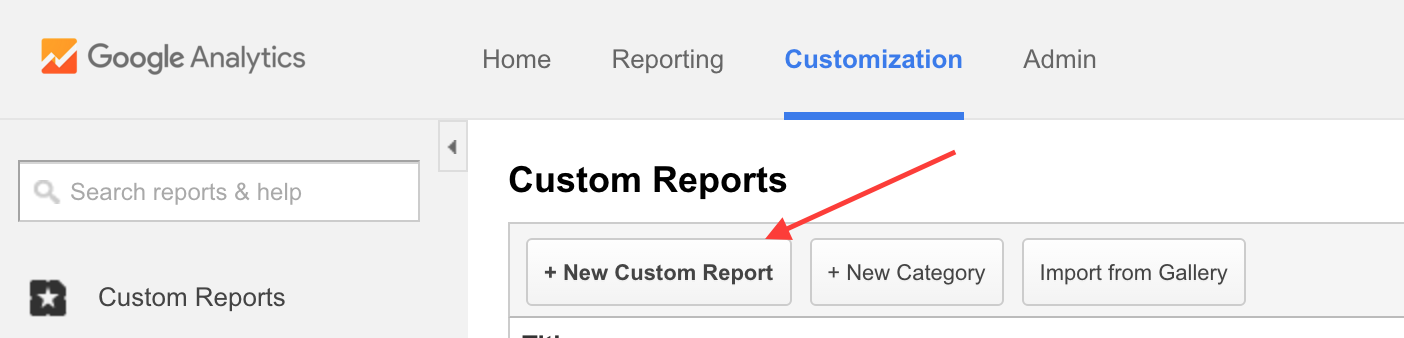
In GA, go to the “Customization” tab in the navigation and click the “+ New Custom Report” button.
Under “Metric group” add in “Sessions,” and under the “Dimension Drilldowns” section add in your Optimizely experiment variation. Click “Save.”
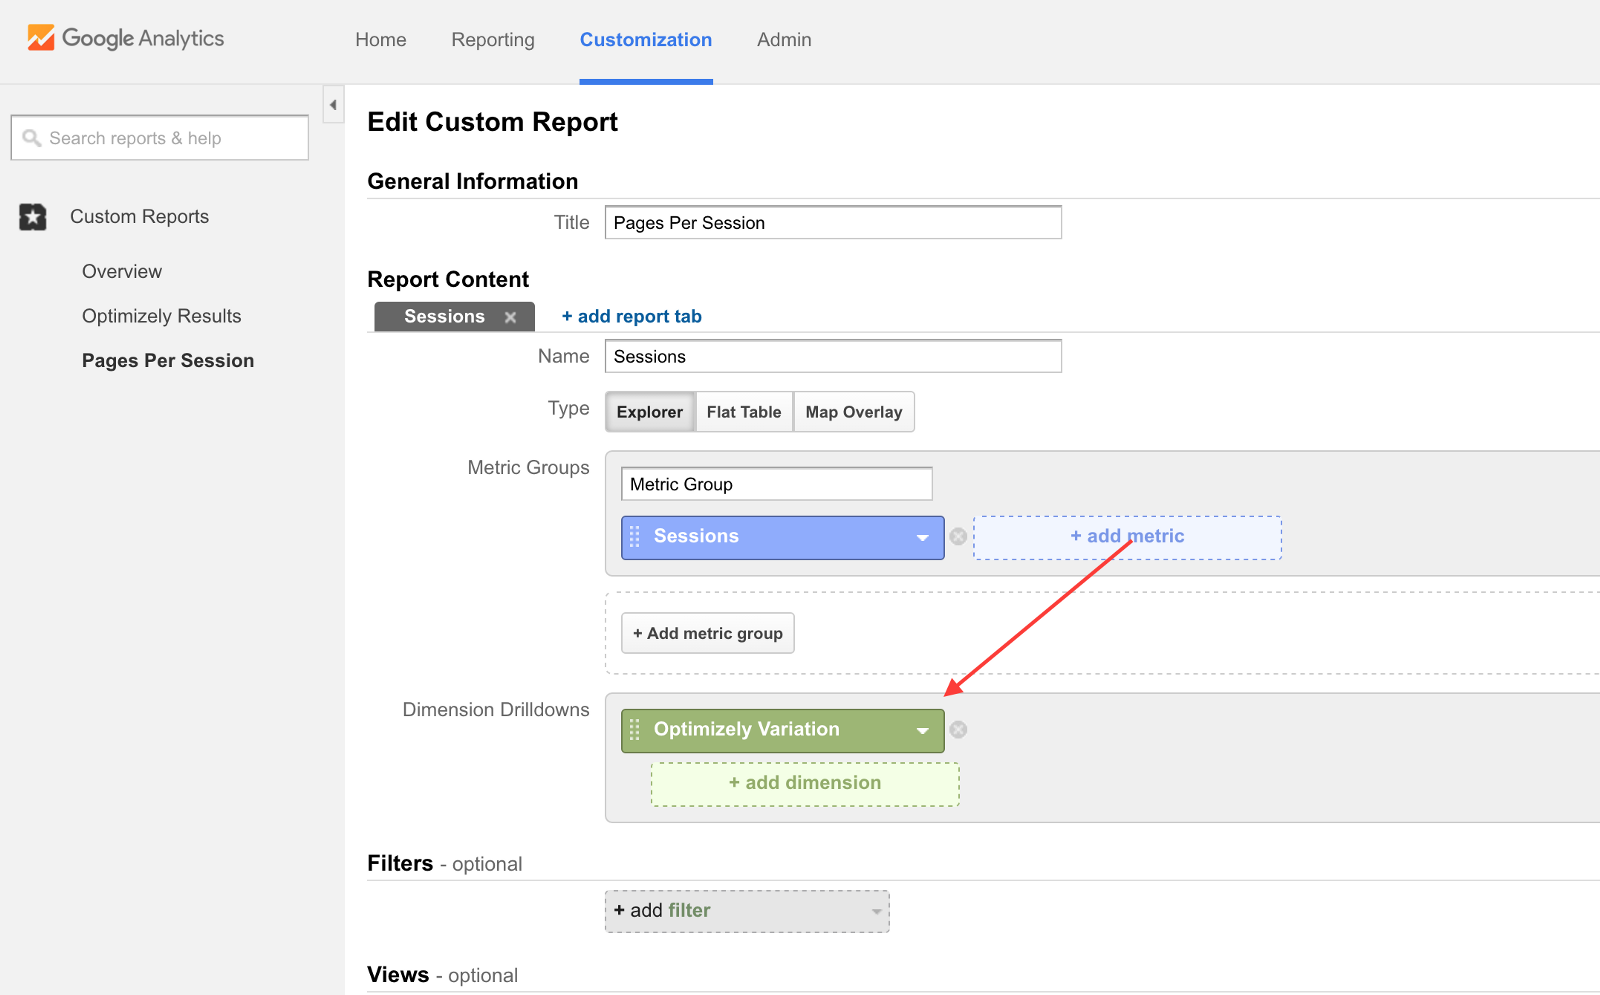
You should be taken to the report page. If there are values for the dimension other than the two variations then click “edit” and add a filter to only allow your two variations in the report. For example, you can use a regex filter “Optimizely Experiment XXX” to only match variations from that experiment.
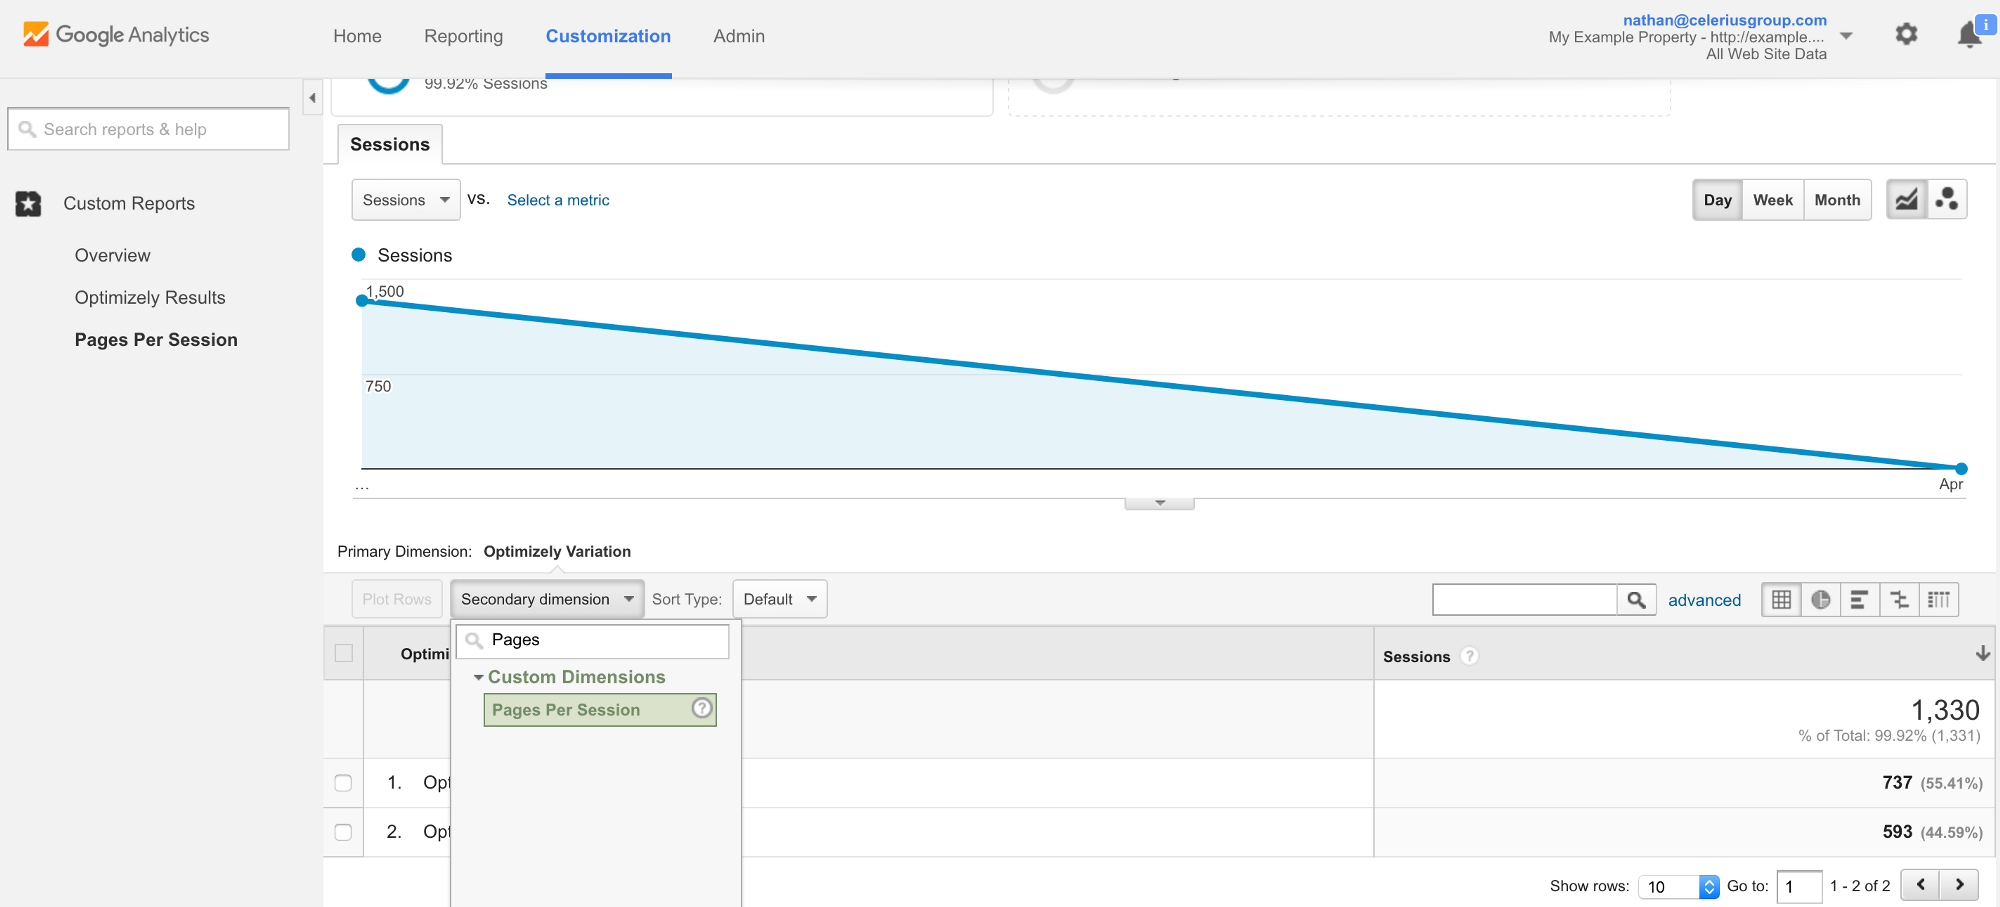
Once you’ve got your filtered report, click on “Secondary Dimension” and add your “Pages Per Session” dimension.
In order to export the data to run an analysis you will need to make sure you’re displaying all of the rows. On the bottom of your report change the “show rows” field to be large enough to show all of your rows.
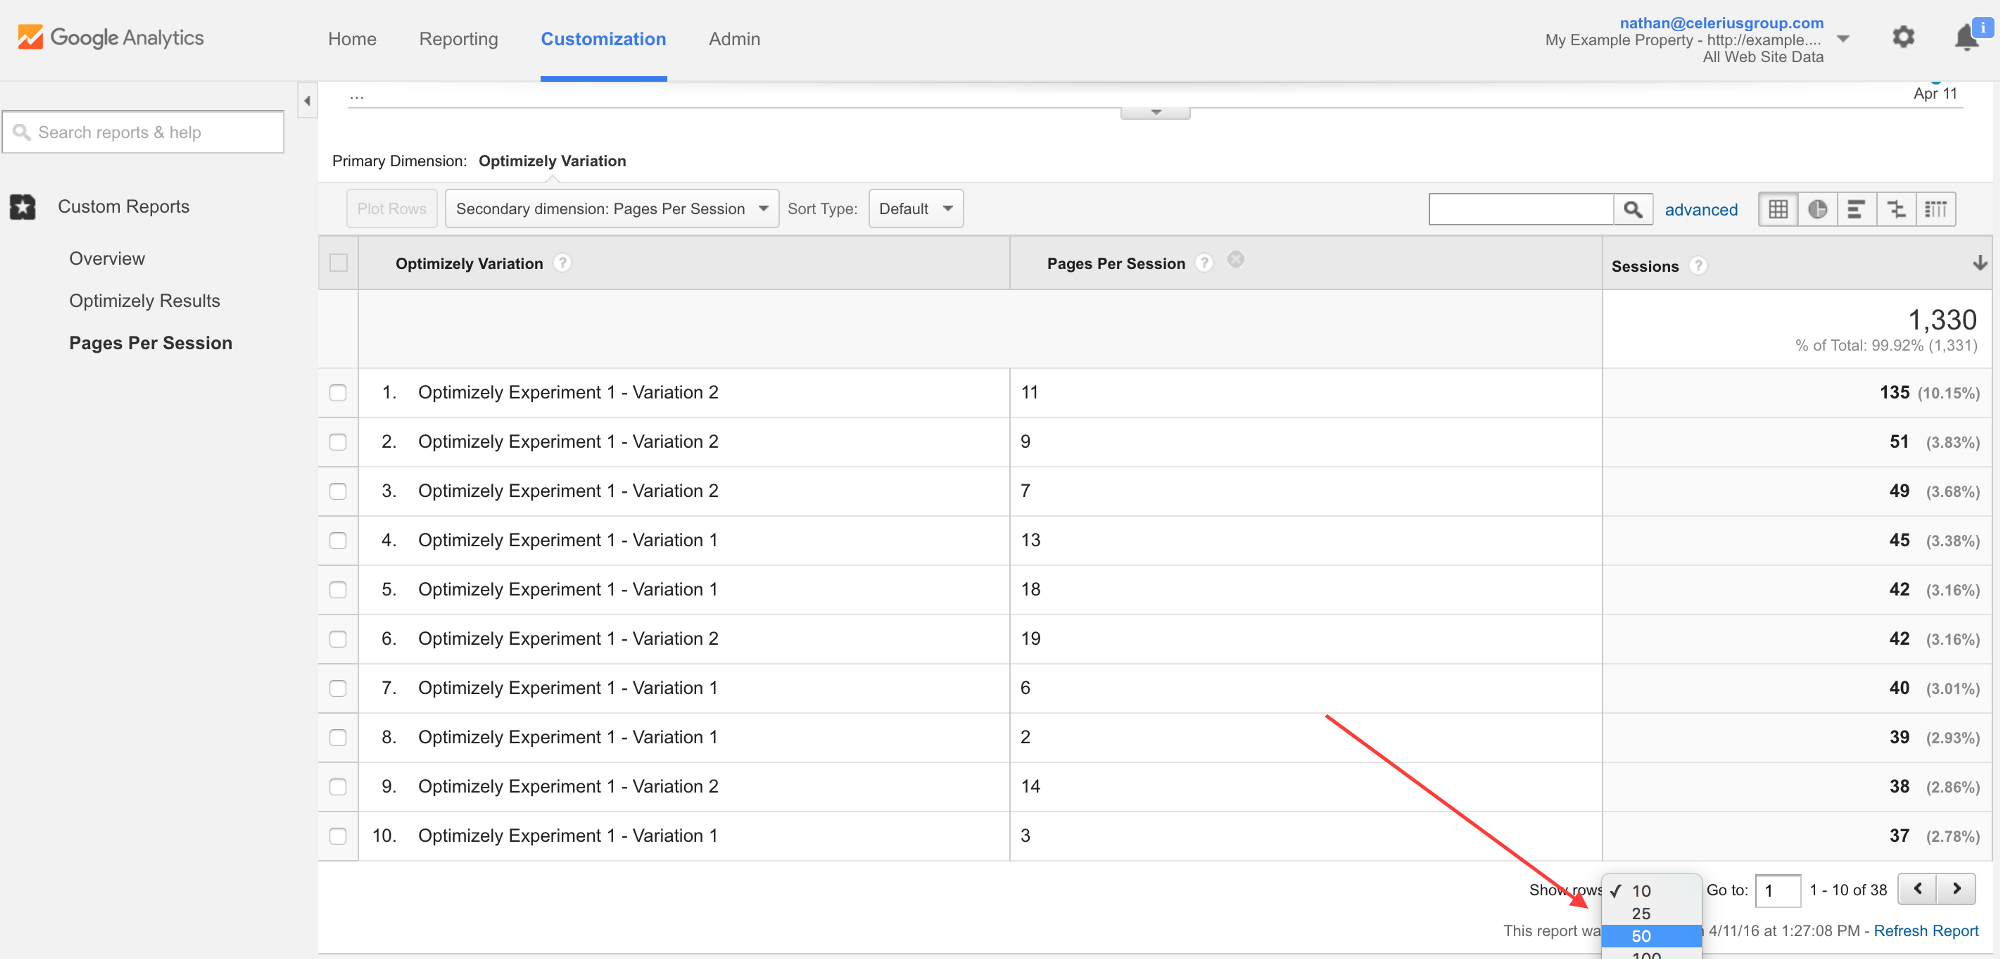
Now click “Export” then export the report to a .csv file
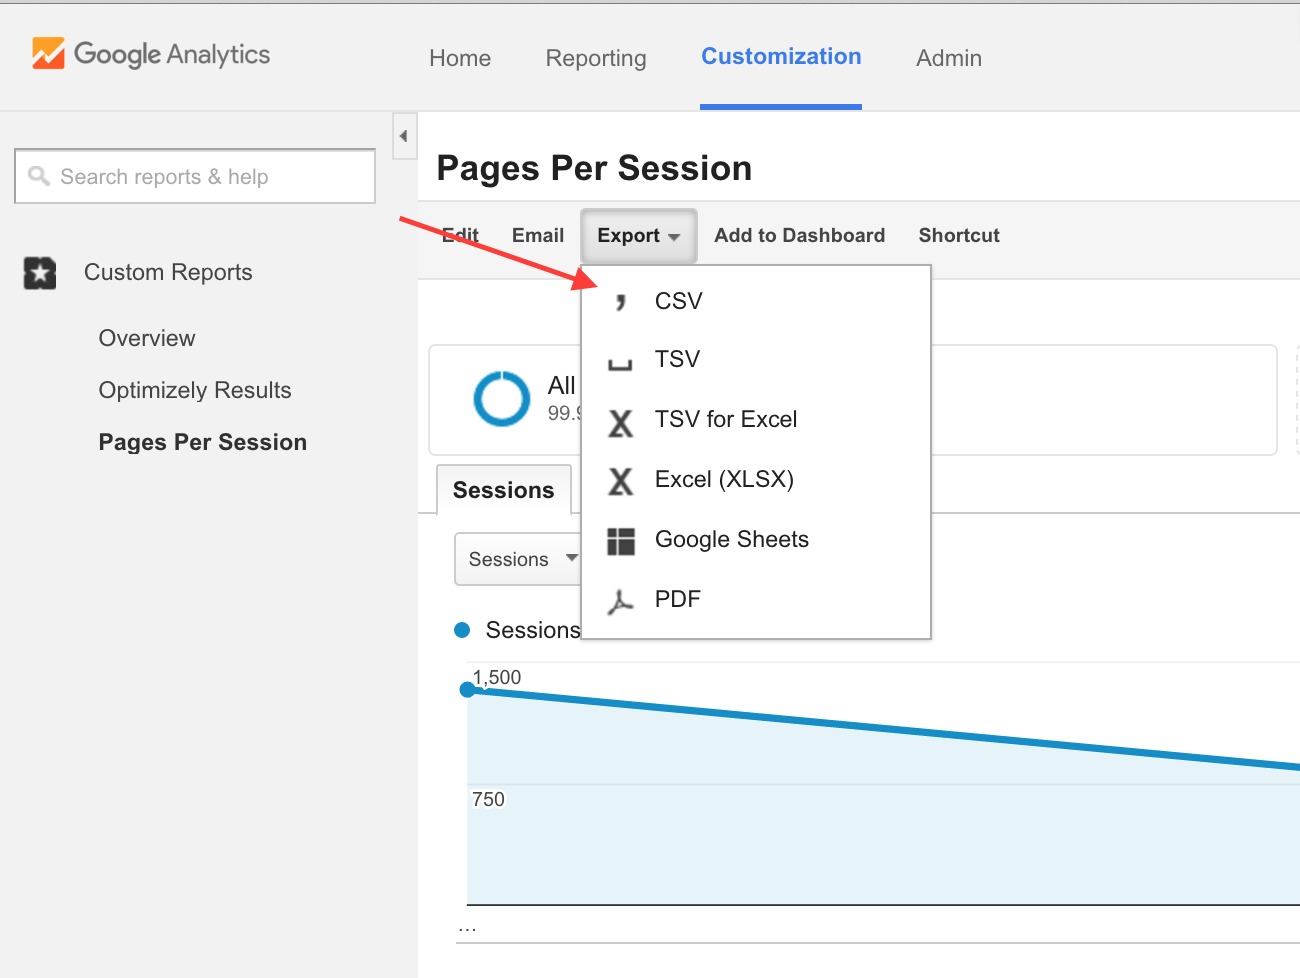
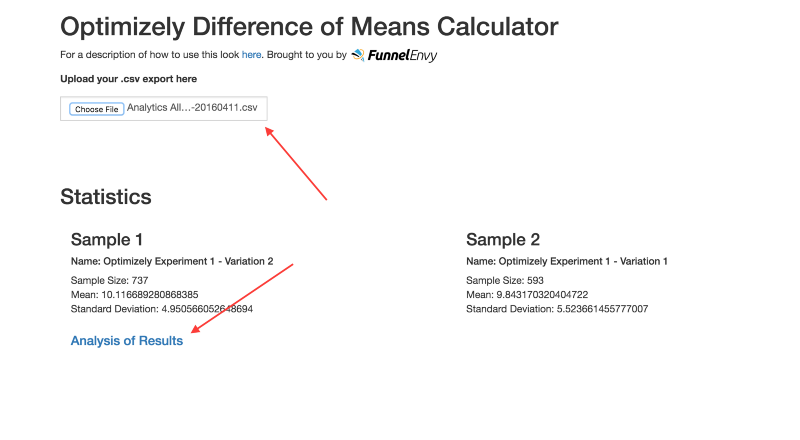
You can now take that CSV and upload it directly into the calculator here.
Upload the .csv file to the input on the page then click the “Analyze Results” link.
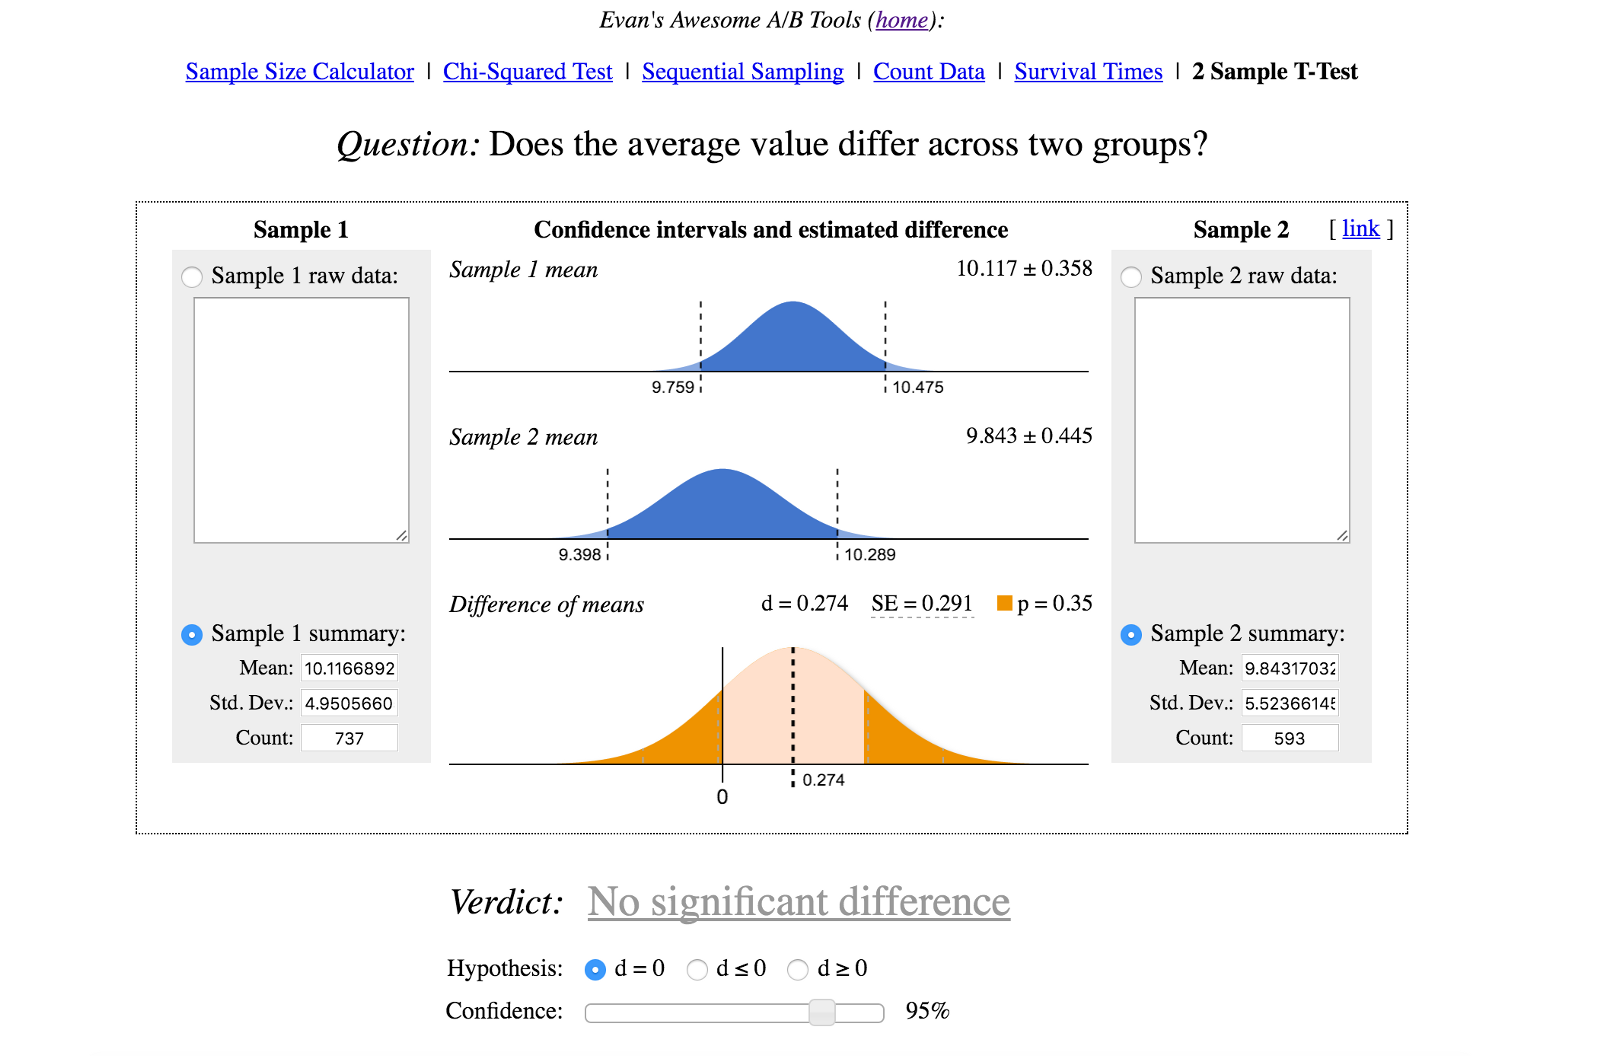
The results page will tell you whether or not there was a statistically significant difference in the two groups in the “Verdict” section. This is what you should end up with: