Comparing Pages Per Session Across Variations in Optimizely
The tools that Optimizely gives you out of the box are excellent for lead gen or e-commerce sites. And while conversion metrics can and should be used for media sites, more often than not you’ll also want to be able to track the effect of any given experiment on pages per session.
The problem is that Optimizely, in most cases, will only let you track differences in whether or not a single event happened — a conversion. Optimizely also has built-in support for tracking the difference in revenue per visitor, but not for the difference in the average of any other metric that you might be interested in.
For the purposes of this post, I’ll be writing about how to get around that specifically for pages per session, but this can be used for any metric that can be tracked in Google Analytics.
Tracking Pages Per Session in Google Analytics
To get started, we’ll need to start tracking pages per session as a dimension in GA. Google Analytics will already track Pages Per Session as a metric, but since we’ll need the distribution in order to perform the analysis of the data we’ll need to track it as a dimension.
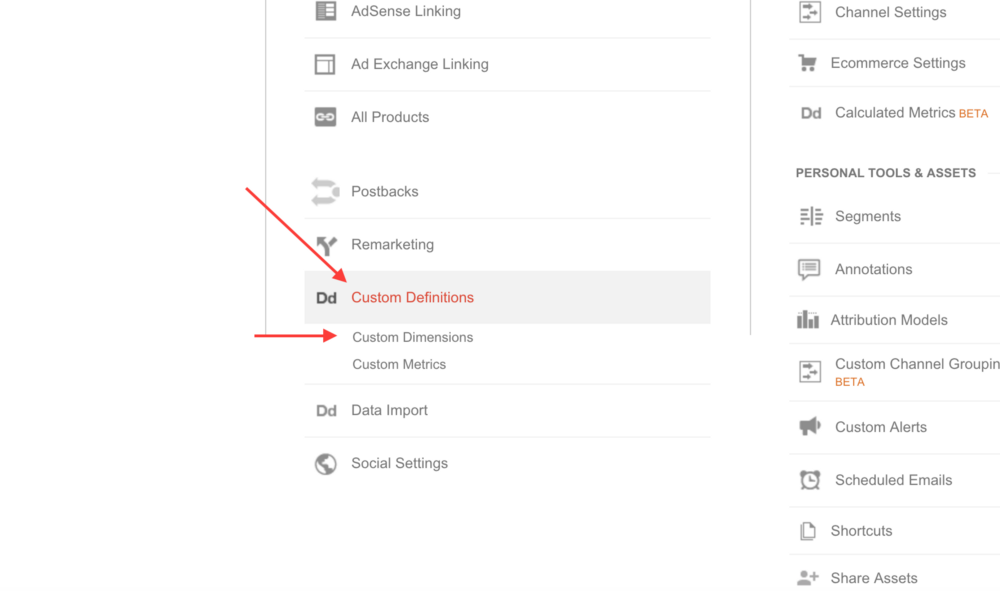
First, we need to create the dimension in GA.
Open up your Google Analytics account and click on the admin section.

Next, go the “Property” panel and click on “Custom Definitions” then “Custom Dimensions.”