How To Improve Your Site Experience In A User-Centric World (And Still Generate Leads)

The algorithmic world of web optimization is rapidly moving towards a user-centric paradigm. To keep up, brands will need to prioritize their site experience like never before. 

In this post, we’re going to cover why site experience is key to your success and give you some actionable tips you can use to improve your site experience today. 

Let’s get into it!

Your site experience is key to generating leads

Website experience, or UX, encompasses everything your users encounter when they visit your website. It’s the visuals, the ease with which they can uncover information, and the process they go through to make a purchase. 

In a world that is becoming more user-centric, focusing on user privacy and moving away from keyword-based SEO, lead generation is going to become increasingly entangled with the performance of your website. The better your site experience, the more leads you’ll generate. And, with that in mind, here are our top ways to improve your site experience…

5 ways to improve your site experience

1. A great site experience starts with pages that load quickly

The first thing that anyone is going to notice when they visit your website is how quickly it loads. Or, ideally, they won’t notice this at all.

The goal for any website should be for any page on your site to load in less than three seconds on an average WiFi download speed. If your website takes longer than this to load, you have some work to do. When it comes to mobile, things need to be even faster. Less than two seconds is ideal for reducing your bounce rate. 

One of the first things you should do to reduce a web page’s load time is to compress all of the images on your website. There are free resources online (like TinyPNG) that will quickly compress images for you. 

Plus, white space is also important. Not only is it important to a pleasing design, but blank space loads faster than content-filled space. 

And, finally, ensure that the most important and visible elements of your webpage load first. Typically, buttons and navigation bars should appear first, then your text, then images and media. 

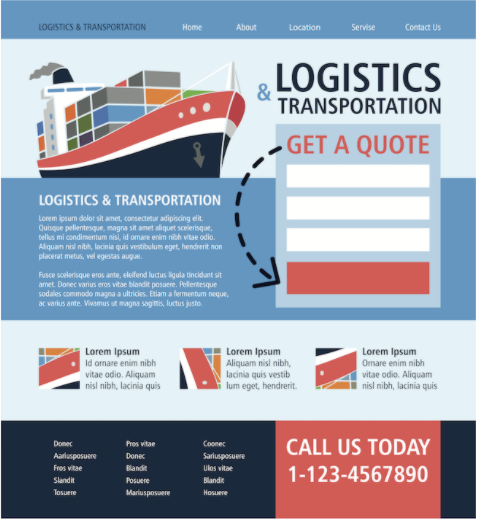
2. Simple and efficient registration and sign-up forms are crucial

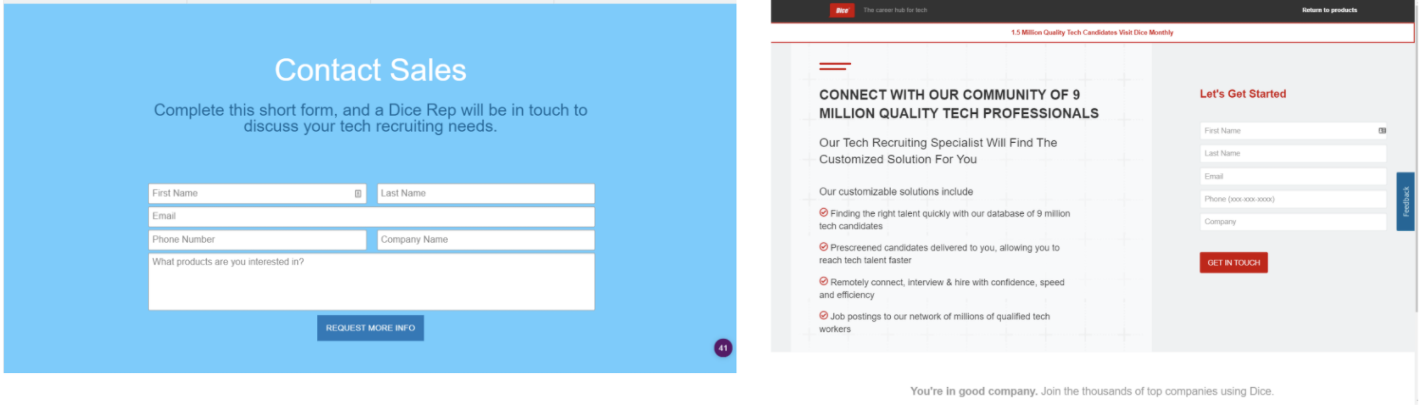
Another crucial component of a great site experience is simple registration and sign-up forms. These are the forms on your website that visitors use to sign up for your newsletter, subscribe to your service, and register an account on your website. 

If these forms aren’t easy to use, then visitors aren’t going to use them. When you ask your visitors to complete a task, you aren’t just asking for their attention span, but also their mental effort. Seamlessness is key. 

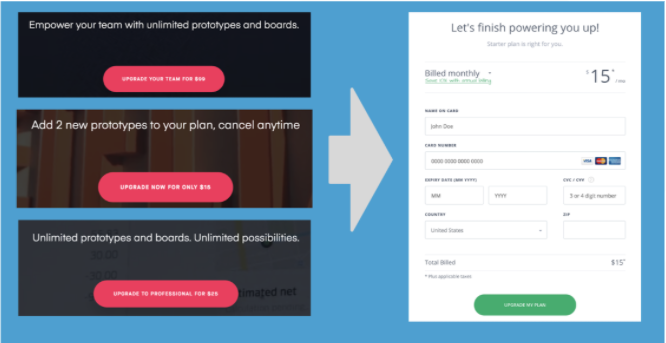
A simple form process uses as few fields as possible, doesn’t needlessly violate the person’s privacy, and keeps everything on one page if possible. The more information a visitor has to give and the more pages that have to load for them to give, the more likely they are to bounce.

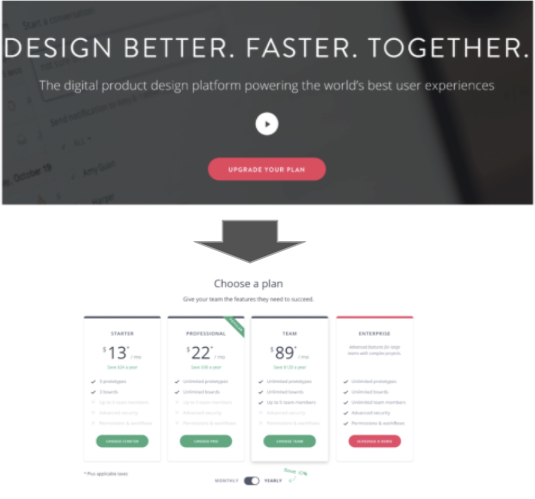
3. Have clear CTAs –– and not too many of them!

Everyone working in the marketing industry knows that CTAs dramatically increase engagement. Direct CTAs, such as “Order this product today!” as well as indirect CTAs like colorful buttons both count. They give a webpage purpose, guide visitors down a path, and most importantly, close sales!

Despite the overt marketing at work here, visitors like CTAs. They’re on your website because they are curious about your business. CTAs make their journey simple. Click here for this information, go here to buy this, and subscribe in these three steps. 

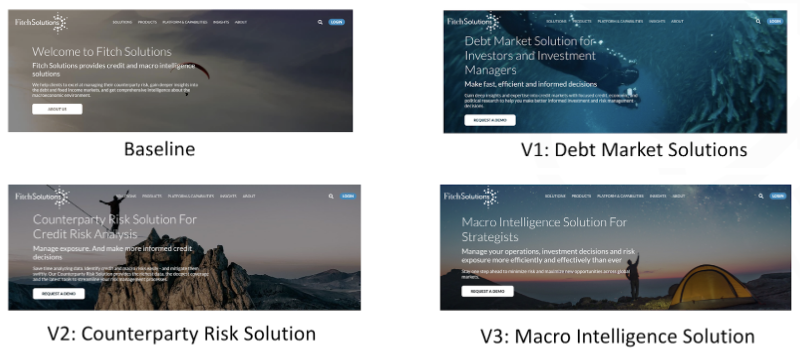
On the other hand, you can overdo your CTAs. Try to keep it to just one CTA per page, and don’t have every CTA be aimed at landing a sale. Maybe have a CTA to your newsletter on your blog instead of a CTA for a product you sell. Or, work on personalized CTAs (or smart CTAs) tailored to different audiences and their specific needs. 

And use clever design and logical flow when placing your CTAs. You don’t need a big red arrow telling visitors to look at your CTA if you place the CTA where they’re already looking. 

4. Follow conventions creatively over creatively ignoring them

A common pitfall that businesses run into is the idea that everything they do needs to be unique to them. So they overcompensate when doing something simple (like crafting a great site experience) and try to stand out by breaking convention.

This more often than not will scare visitors off. Design conventions exist for a reason –– because they work! And because conventions are popular practice, they’re what users expect when they visit your website. 

Moving the navigation bar to the bottom of the screen adjusting all of your text to the right, and having images of your product flash around the screen will help you stand out –– but probably not in the way that you hope for. 

Instead of trying to be quirky, stick to tried-and-true web design conventions. Then, put your personality into them! Follow traditional functional practices while adding unique and personalized aesthetics to your website. 

A pleasing color scheme and clever animation in an otherwise standard website will take you much farther than an obtuse (albeit original) site experience.

5. Save your writing for the blog

Our last tip is pretty simple. Save your writing for your blog! Articles and content marketing perform great there, but they’re not going to perform as well on your landing pages. 

Instead, try to replace text content on your home and landing pages with graphics, blurbs, and bullet-point lists. Video content performs particularly well on landing pages (not so much on your home page). Use text in short sentences to give clarity, flow, and concise information. For everything else, stick to visuals!

Eager to keep learning about how to improve your site experience?

The tips listed above are just a few of the ways that you can improve your site experience. To become a lead generating pro, you can check out the rest of the posts on the FunnelEnvy blog.

And if you’re ready to take your marketing and site performance to the next level, reach out to the FunnelEnvy team for expert advice, guidance, and optimization. 

By |2021-06-04T00:02:20-07:00June 2nd, 2021|Uncategorized, Conversion Rate Optimization, Analytics, Strategy, B2B, Experimentation|Comments Off on How To Improve Your Site Experience In A User-Centric World (And Still Generate Leads)

Revenue attribution: Everything You Need to Know to Ramp Up Your Marketing ROI

Revenue is a top priority for any business, no matter how big, no matter how small. It’s fundamental: without money coming in, you’ll have nothing to cover overheads or invest back into the company. 

We all know that a hard-working sales team is key for bringing in new business and increasing revenue. But revenue is increasingly a priority for marketing teams too. 

Many marketers turn to ROI (return on investment) to determine the profitability of a promotional campaign. In fact, more than 40% of marketers claim their main priority in 2021 is to “better measure the ROI of [their] demand generation initiatives”. 

It makes sense: effective marketing should achieve a healthy return on investment (ROI) and generate new revenue. A portion of this can then be invested back into marketing campaigns to keep bringing in more money, and so on. It’s a cycle of profitability that can help businesses grow and grow. 

And revenue attribution can help you create more effective, successful marketing campaigns. But what does it mean and involve? 

In this article, we’ll explore everything you need to know about revenue attribution and how it relates to improving marketing ROI. 

What is revenue attribution? 

Revenue attribution (also known as marketing attribution) is a reporting process that involves matching revenue brought in, to a specific marketing output. 

For example, you might utilize revenue attribution techniques to monitor the impact that a particular piece of thought leadership content made on sales within two months of its publication. Or you may prefer to track the effect that a new series of videos made on revenue over a shorter or longer period. 

Businesses have more channels — and more opportunities — to reach consumers than ever with targeted marketing campaigns. But it’s unbelievably competitive and marketing teams must take advantage of real creativity to make an impact, especially in the most crowded sectors or niches. 

Employing revenue attribution techniques empowers marketers to hone in on their most effective work and understand how they can keep refining their techniques over time. 

Why is revenue attribution important and how can it help?

Revenue attribution is crucial for marketing teams who want to gain a clear insight into their strategies’ value and learn how they affect customer engagement. Fortunately, there’s a wealth of data available online to help marketers build an accurate overview of campaign performance and ROI. 

Identifying how specific campaigns and strategies have been received by audiences (target and/or general) enables you to make more informed, calculated decisions on future campaigns. 

You’ll have a tighter grasp on what works, what doesn’t, and what elements should be combined to cultivate the most impactful marketing campaigns. You’ll be able to capture more leads, close more sales, and improve ROI thanks to continued analysis. 

Another key benefit is that revenue attribution helps businesses (particularly those in their infancy or experiencing financial challenges) get more out of their marketing spends while still streamlining their budget. 

Essentially, it can make your money go further. You’re not throwing ideas at the wall to see what sticks — you’re basing your decisions on provable facts. 

You can jettison those marketing techniques and campaigns that fail to bring in satisfactory ROI. All resources usually dedicated to those will be put to better use on more effective options instead. 

How can you use a revenue attribution model to measure and ramp up your marketing ROI?

We understand what revenue attribution is and why it matters. But how do you put a revenue attribution model to work and start improving your marketing ROI?

While it can appear complicated for newcomers, and more than a little daunting, it will seem far simpler when we take a deeper look. In this section, we’ll cover how to use this model to both track and measure ROI — and improve it. 

What types of revenue and marketing attribution models are available?

First-touch attribution 

The first-touch (or first-click) attribution is one of two single-source models (along with last-touch attribution, below). 

In this model, the first channel with which a converted user engages receives all credit for generating revenue. This could be an in-depth whitepaper, a blog post, a video, or any other piece of marketing content that captures the lead’s interest enough to drive a conversion. 

For example, around half of marketers describe webinars as the top-of-the-funnel format generating the most high-quality leads. 

While a spectacular piece of content can be enough to push users towards a sale, the first-touch model may have a blindspot — a failure to take other interactions following this first one into consideration.

As a result, you may not have an accurate insight into how effective other channels are in swaying users’ decisions. 

Last-touch attribution 

Last-touch (or last-click) attribution is regarded as another easy model. Why? Because it involves looking at the final touchpoint before the sale is completed, which is usually simple to find.

The last touch could be something as straightforward as a well-researched sales call or a webinar that whets the lead’s appetite and inspires them to commit to a purchase. 

However, the last-touch attribution model may overlook previous interactions with a user. These could include a visit to your website or hearing an ad for your business on a podcast. And, again, this could cause you to overlook the value of other channels 

Multi-source attribution

As you can probably assume, the multi-source (or multi-touch) attribution model focuses on all channels that lead to a conversion. Multiple touchpoints will be attributed instead of just one. 

Still, while the multi-source attribution model is more of a holistic approach to measuring marketing success, there’s a crucial factor to consider: it doesn’t provide an accurate reflection of a specific touchpoint’s actual contribution to a conversion. It could lead to a false representation of certain channels’ role in the customer journey. 

Six multi-source attribution models are available:

  • Linear: This is the easier model to implement, providing all touchpoints with the same weight, though it can be hard to determine which were most important (as mentioned above). 
  • Time decay: Touchpoints will be separated by bigger and bigger gaps in long sales cycles. With the time decay model, you’ll apply greater credit to those in the later stages than those in the earlier period. They might not have been as valuable to the eventual outcome, and in particularly long sales cycles, the buyer might have totally forgotten about their initial interactions with your business anyway. 
  • U-shaped: A U-shaped revenue attribution model applies the credit to two main touchpoints, with fixed percentages. These are the initial touchpoint and the last, as well as any between those points. The first and last touchpoint receive 40% of the credit each. The 20% remaining is split between those touchpoints taking place in between. 
  • W-shaped: A W-shaped model is similar to the one above, but it adds an extra touchpoint: when a prospect is converted into a lead. So, this covers the first touchpoint, the last touchpoint, and the occurrence falling somewhere between them. These receive 30% of the credit each, while the remaining 10% is shared among other touchpoints that may be detected between them. 
  • Full path: The majority of the credit is assigned to the key steps in the customer journey and the rest goes to those touchpoints between. Unlike the other models explored so far, this includes follow-up chats between the customer and the sales team. 
  • Custom: Teams can come up with their own weighting shares according to the channels used, customer behaviors, etc. For example, you may decide that a user who subscribed to your newsletter should have more weight than someone who clicked on an ad. 

Weighted multi-source attribution 

Weighted multi-source attribution involves accounting for every interaction during the sales cycle and assigning weight to the most important touchpoints. This model can lead to the most reliable views of a customer’s journey. 

However, it’s one of the most challenging to put into effect, as weight must be applied to a potentially large number of touchpoints. 

Why is it so important for marketing and sales teams to work in partnership?

Traditionally, businesses tend to keep sales and marketing activities separate. They consider marketing teams’ role to create leads and sales teams’ to transform them into paying customers. That’s simple enough to understand — but it could be a big mistake. 

Why? 

Because overhauling and refining your marketing to achieve an increase in leads won’t guarantee a rise in high-quality leads. 

Yes, marketing teams can drive clicks and interest, but a large proportion of leads could be of a lower quality than expected. 

The aim should be to bring in leads more likely to evolve into conversions, based on carefully targeted marketing with specific demographics in mind. 

By uniting your marketing and sales teams, you can start to develop a clearer understanding of which marketing efforts bring in the most valuable leads and, ultimately, conversions. Those that consistently generate the weakest leads and harm ROI should be replaced. 

What are the key benefits of using these revenue and marketing attribution models?

Here are five key benefits of using revenue and marketing attribution models:

  • Improved ROI
    Effective revenue attribution provides businesses with an accurate insight into how much return they gain on their marketing investments. Over time, you can start to cultivate a better awareness of those techniques and strategies that engage your target audience best.

    And you’ll keep reaching the right people with the most appealing messaging. This will increase the number of conversions you can expect to achieve and, eventually, the ROI you earn.

  • Save money on ineffective marketing
    Attribution models reveal the most important touchpoints throughout sales cycles and show how marketing money is best invested. Fewer funds will be wasted on dead-end marketing.

    That may free up money to channel into better marketing or other areas of your business, including sales or post-purchase support.

  • Hone your audience targeting
    Audience targeting is one of the top methods through which advertisers increase demand. And studying attribution data reveals which types of content, messaging, and channels engage your ideal customers best.

    Marketing teams can keep sharpening their material to consistently engage your target demographic(s) and minimize the risk of missteps.

  • Learn how to make products or services better
    Marketers can get a better understanding of target customers through attribution data analysis.

    Over time, this can open your eyes to ways in which you can improve products or services to suit your audience better. For example, the response to a blog post covering specific software features could inspire future releases.

The power of Revenue Funnel Optimization 

Hopefully, you’re now in a place where you can see the key benefits of revenue and marketing attribution to your business. But, one of the most important aspects of attribution strategy is acting on attribution insights. And, that’s where we come in…

We’ve designed our Revenue Funnel Optimization strategy so you can get the most out of your revenue insights. 

FunnelEnvy enables you to generate revenue insights by updating analytics to measure the complete end-to-end customer journey. You can pinpoint the most valuable funnels, offers, and other factors that drive revenue. 

Revenue funnels comprise strategy sets focused on maximizing your website’s revenue generation through targeting the most effective offers to the priority buyer segments in your top conversion funnels. 

Funnels can also be personalized by the user’s stage in the customer journey to maximize revenue further. You also can run campaigns and experiments on your most important funnels. Use direct response best practices to optimize offers, messaging, and more. 

With Revenue Funnel Optimization, your decisions are driven by data and genuine insights into the buyer journey. 

You’ll make stronger choices for your marketing and sales teams — and your business as a whole — by studying the facts. 

Many companies are already achieving success with Revenue Funnel Optimization, with up to 250% growth in revenue and a 10x increase in Marketing Qualified Leads (MQLs)

Want to try Revenue Funnel Optimization? Start using FunnelEnvy and drive real revenue growth for your business! 

By |2021-06-04T00:02:29-07:00June 2nd, 2021|Uncategorized, Conversion Rate Optimization, Digital Marketing, The Funnel, Strategy, B2B|Comments Off on Revenue attribution: Everything You Need to Know to Ramp Up Your Marketing ROI

Don’t Fear a Cookieless World, Instead Shore Up Your First-Party Data to Optimize Your Funnel

If you haven’t yet heard, the cookie is on the outs — much to the cookie monster’s chagrin. The death nell was sounded by Google’s announcement of Privacy Sandbox, which is basically their plan to create a set of privacy standards.

This plan includes improving how cookies are classified, clearing up the details behind each person’s cookie settings, and plans to aggressively block fingerprinting. A fingerprint is created by stitching together a bunch of tiny signals about a person to create a full profile, and since people can’t access or delete their fingerprint, Google’s basically going to make it impossible to create them.

All of these intentions add up to one pretty plausible result — third-party cookies (the type used to make fingerprints, and fuel activities like retargeting) won’t be around much longer.

There’s another type of cookie though that’s not going anywhere — the first-party cookie, which allows marketers to collect first-party data. Focusing on shoring up your first-party data will not only prepare you for the death of the third-party cookie, but result in a stronger marketing strategy overall, regardless of the third-party cookie’s fate.

In this article, we’ll talk about the difference between the first and third-party cookie, why the first-party data is more valuable anyway, and how to use it to optimize your demand generation funnel.

First-party cookies vs. third-party cookies

Before we get into exactly how and why you should focus on first-party data, let’s straighten out the two types of cookies:

  • A first-party cookie is created and stored by the website you’re visiting; the one in the address bar. If you’re a site owner, first-party cookies allow you to collect data like customer analytics, language settings, the user journey, and other information that can assist you in improving your customer experience on-site.
  • A third-party cookie is created by sites other than the one you’re currently visiting. These other sites own some of the content, like ads or images, that you see on the site you’re currently visiting, and can therefore collect information about you while you’re there.

For example, say you’re shoe shopping with popular retailer DSW. When you visit DSW.com and shop for boots, you might not purchase right away. During that first visit, the homepage looks like this:

dsw-website

The next time you visit their site, there’s a new section of the homepage that displays the shoes you clicked on during your last visit. DSW dropped a first-party cookie on their site in order to remember that you were interested in buying boots. They then used this information to personalize your experience the next time you visited their site.

dsw-personalized-shoes-first-party

During this second visit, you made a purchase and provided your email. Two days later, DSW sends you an email about an upcoming boot sale. That’s first-party data. DSW used a combination of first-party cookies and personally identifiable information (PII), namely your email address, in order to personalize your experience.

dsw-third-party

Third-party cookies are most often used to retarget you on sites other than DSW.com. Perhaps after shopping for boots, you head over to nytimes.com to read up on the news. As you’re reading an article, you see a Google-owned banner ad advertising the shoes you just looked at:

nytimes-dsw-retargeting-ad

A lot of data exchange went on behind the scenes for you to see this ad. First, DSW partnered with Google and started using Google Ad Manager to serve ads around the web. The New York Times also partnered with Google to display ads on their site, in order to monetize their content.

Google then dropped a third-party cookie on DSW’s site to collect data on your visit, and DSW retargeted you on nytimes.com in the hopes of capturing your attention, and bringing you back to your site.

These are the types of cookies that Google is looking to guard against, and they’re the ones that are likely to die in the coming year.

Your first-party is data more valuable than third-party data anyway

The thought that third-party cookies are on the way out has caused a bit of a panic among marketers, mostly because they’ll have to come up with new ways to retarget site visitors.

But the thing is, focusing on first-party data is way more lucrative than scaling retargeting campaigns based on third-party data. First off, you collected that data directly from a person, and you know it’s accurate. Second, because you collected that data while that person was visiting your site, you know they’re actually interested.

Let’s go back to our shoe example — which interaction with a potential consumer would you find more valuable — the one on your owned website, or the display ad impression they probably didn’t see?

We bet your answer is the former.

First-party data is more valuable because it’s the best indicator of buyer stage, and therefore intent. Someone visiting your website has a much higher intent to interact with your brand than that of someone who saw a display ad.

For demand generation marketers, buyers go through many stages in their journey, so it’s really important that the data you’re collecting on those buyers captures their intent at each stage.

FunnelEnvy combines first-party data insights and offers personalization in order to align the offers on your website to the intent the buyer has at the time they’re visiting. This way, you move them down the funnel every time they visit, leading to better conversion rates and ultimately more revenue.

Here’s an example from Fitch Solutions. They guide their clients in making clear-sighted decisions through data, research and analytics on the capital markets and the macroeconomic environment.

Like many B2B technology companies, they thought of their homepage as a type of welcome center where they introduced themselves to people getting to know them for the first time:

Fitch-solutions

But, also like many B2B technology companies, they saw a lot of returning traffic, which is often a result of having a longer buyer journey. A “welcome center” isn’t an optimal experience for someone you’ve already welcomed.

FunnelEnvy worked with Fitch Solutions to personalize their homepage experience for each visit, and for returning visitors, they surfaced a relevant offer in place of their welcome message:

fitch-solutions-personalized-site

This change resulted in a 55% increase in conversion on site. By doubling down on optimizing their website using first-party data, Fitch Solutions made a huge impact on their funnel.

Optimizing the demand gen funnel with first-party data

So, how do you get from collecting first party data to activating it with a personalized experience on-site? The biggest challenge for the demand generation marketer facing the death of the third-party cookie is that first-party data is often siloed away in places like your customer resource management (CRM) software, marketing automation and in website analytics. 

If you want to truly personalize an experience, you need to bring all of that data together for a holistic view of the consumer journey.

The effort is well worth it — in fact, 77% of B2B sales and marketing professionals believe that personalization builds better customer relationships.

But to get there, something needs to bring all of that siloed data together so that you can target accordingly by buyer stage. The FunnelEnvy Backstage platform brings together these data sources, website analytics and experience tools to create a unified customer profile.

If you have the data, you can get sophisticated with offer personalization. You can attribute different user experiences to revenue, target by buyer stage and scale revenue.

Here’s an example from TIBCO Jaspersoft. They had one static product page that contained multiple offers for different personas within the organization. 

TIBCO-jasper-solutions-site

When they tried to squeeze multiple offers on a single page, offers competed for attention and blended in, which put the onus on the user to determine which was right for them. 

We worked with them to target specific personas with a single offer, based on data they had stored in their marketing automation platform. Through testing variations that replaced the default experience with a single focused offer, we saw an almost 50% improvement in revenue per visitor.

Conclusion: the death of the cookie is nothing to lament

While the death of the third-party cookie will mean a shift in strategy, there is a huge silver lining — as it’s phased out, demand gen marketers can use the opportunity to shore up their first-party data strategies, which are likely to result in a much larger impact on their funnel.

We’ll see less focus on (admittedly crappy) ad buys and retargeting campaigns, and a larger focus on leveraging first-party data insights better at home.

If you’re stuck on where to start when it comes to shoring up your first-party data strategy, we can help. Apply now to get started.

Optimize your Revenue Funnel by Focusing on the Offers

Let’s take a step inside the data-driven demand generation marketing team. The biggest concerns on the CMOs radar are that the acquisition costs are too high and not hitting their pipeline or revenue goals.  Now looking at the data, we know that not only are they spending a lot on paid and organic traffic, but the quality of the traffic is good, and it’s not converting.

So, of course, the next question would be – what can they do about it? A common answer is to focus on website conversion rate optimization, which involves running online experiments. That’s something you can put a budget around and prioritize but recognize that your executives are going to want to see impact based on pipeline and revenue and probably want to see it fast.

Online Experimentation

Back in 2017, the Harvard business review published an important article digging into the power of online experimentation. In it, they correlated successful business outcomes to a culture of experimentation. 

harvard business review article title

Image Source: The Surprising Power of Online Experiments (Harvard Business Review | Link)

The article cited examples like the one below from Bing,  who tested multiple different colors on their site, ran experiments. and realized an incremental $10 million in annual revenue from these experiments. 

small changes with huge image image harvard business review article

Image Source: The Surprising Power of Online Experiments (Harvard Business Review | Link)

Similarly, Google ran a test with 40 different shades of blue on their site. When they ran those experiments, they achieved $200 million in incremental revenue. Given these results, should we, as demand gen marketers, be running the same experiments?

In our opinion and experience, no, you should not.

You’re not Google or Bing. Leaving aside traffic considerations, you’re trying to influence B2B buyer behavior over customer journeys. And the reality is that groups of buyers that consider enterprise solutions are not going to buy based on the button color or other small cosmetic changes.

This is important because experimentation comes with a cost. Not only do you have people and the technology costs of running online experiments, but also your organizational ability to make decisions. So, focus on the elements that would deliver revenue and influence those B2B buyers when you’re thinking about experimentation.

When we think about the B2B buying journey or the revenue funnel it’s common to conceptualize it as a series of buyer stages. As prospects progress through those stages, they do so through exchanges, in which you’re offering something to that prospect in exchange for something else. The offer could be some content in exchange for their attention, an event, or an opportunity to speak to the sales team in exchange for their contact information. Ultimately those offers are how they learn more about your solution and how it would benefit them. 

funnelenvy funnel image

From our experience and the testing that we’ve done, the highest leverage use of experimentation for the demand gen org is to improve the relevance of those offers and the ease of engaging with them throughout the buying journey. Of course, we always want to ensure we measure the impact of those experiments based on the KPIs that matter – pipeline and revenue.

Optimizing Offers

logistics transportation image of form

What does it mean to optimize offers? There are three components to an effective offer. One, of course, is the offer itself. That item you’re proposing to exchange with that visitor or prospect for them to understand your solution. The more relevant it is, the more effective your ability to convert them will be.

The second important aspect is how you frame it. Our primary focus here is the headline and Call to Action (CTA). Your headline is important because a visitor will spend five or ten seconds deciding if they want to stay on your site or hit the back button and go somewhere else. So, entice them to continue reading the content on the page.

Finally, the third element of the offer is the exchange and how they provide what you want. Most likely on your site this is a web form, but it doesn’t need to be. It’s increasingly common to see conversational marketing tools (chatbots) that accomplish the same thing by providing that medium of exchange for the offer.

Examples

Let’s look at some examples of how you could optimize your offers.

Landing pages are a great starting point for thinking about your offers. Many of you are probably running traffic to dedicated landing pages and putting an offer in front of the visitors hitting it. But not every visitor is interested in the same offer. In the example below, we recognized when working with a customer that they had three viable offers for those visitors coming through their paid campaigns. And rather than only showing them one, we use data to dynamically personalize the offer itself as well as framing and the page layout to reflect what might be most relevant to that visitor.

landing page offers comparison

When we ran the experiment against the static landing page we saw a 44% improvement in revenue per visitor. 

For most of us the most trafficked page on our site is the homepage. And on your homepage the “above the fold” section at the top gets most of the attention. Many of us think about our homepage in the context of welcoming the first time visitor and introducing your solution as in the example below.

fitch-solutions-landing-page

For SaaS and Demand Generation websites it’s common to have a lot of returning traffic. Since return visitors are familiar with your solution, it wouldn’t make sense to show them that same offer. In an experiment, we targeted these return visitors and the solutions they showed interest in and presented them on the homepage. In this case, those offers were buried in the site and require additional navigation. By presenting this offer they would likely be interested in and serving those directly on the homepage, we saw almost 55% improvement in conversions coming through this page.

fitch-solutions-home-page-offers

You can also target well-defined buyer stages. In the following example, we have a customer with a freemium model where visitors on the free plan come to the homepage and see a CTA or a button prompting them to “Upgrade Your Plan”. The baseline experience was to take them to a set of SaaS plan tiers where they could select the one that they would upgrade to. 

pricing-table-personalization-offer

Using this data, we can identify the specific plans most relevant for any individual and offer them directly on the homepage. The framing included the benefits and replaced the CTA with the cost of that specific plan we recommend. Since we recommend a single upgrade plan, we bypassed the plan selection (and the friction it created) and took them directly to the credit card to upgrade. By removing friction and presenting them with a more relevant offer, we saw an almost 70% improvement in revenue per visitor coming through this experience.

buyer-stage-changes-to-website

The most common mechanism of exchange for the offer is the web form, and as a result, we spent a lot of time optimizing them. It’s important to recognize that there’s a lot of friction for the visitor when they encounter one of these forms.Even if they’re interested in the offer, they face the prospect of handing over their email and other personal information, which often presents a big hurdle. Since it’s common to see drop-offs at this stage, we would like to take those contact forms and reinforce the benefit and the value to the visitor filling them out. In the following example, we tested an updated version of the form page resulting in an 85% improvement in conversions.

form-optimization

If you have the data, you can get sophisticated with offer personalization. It’s common to see pages like the one below. It is a product page that contains multiple offers for different personas within the organization. Unfortunately, when you try to put them all on a single page, they compete for attention and blend in, making it hard for users to know which one is relevant for them. 

TIBCO-homepage-before-personalization

In this case, we target specific personas visiting the page based on data we had in the marketing automation platform and identify the most relevant offer. By testing variations that replace the default experience with a single focused offer, we see an almost 50% improvement in revenue per visitor.

TIBCO-homepage-after-personalization

Final Thoughts

It’s possible to waste time, effort, and money optimizing inconsequential elements of your website. For demand generation marketers, the highest leverage things to focus on are the offers – specifically their relevance to the visitor and the ease of engaging with them.

Before you undertake this experimentation it’s important to make sure you have solid revenue insights. What that means is, evaluating your existing offers as well as future experiments based on their pipeline and revenue contribution.

Some of the personalized examples above require some segmentation. Our recommendation is to prioritize segmentation based on the differentiated intent and addressable size of those segments. We often find that marketers are running building audiences that can only address 5-10% of their audience, or ones that don’t have meaningfully different intent from one another. Ultimately those aren’t going to have much value when it comes to optimizing offers.

This is why we start with buyer stages as our starting point for segmentation because it a large set of well-understood segments with differentiated intent – buyers at different stages will naturally gravitate towards different offers. The vast majority of the visitors coming to a demand gen site fit into anonymous, known lead, active opportunity or existing customer.

Finally, when it comes to improving offers, start with common sense ideas. If you start thinking about your buyer stages, some opportunities should become apparent. For example, should a known lead see a lead capture form, or can we repurpose those pixels for something more relevant? Similarly, should existing customers see the “Request a Demo” or “Talk to Sales” CTA? Maybe there’s an opportunity to get them to support resources or event upsell them. 

What’s stopping you from generating more revenue by improving offers on your website? If you’re a Demand Gen marketer and need help, feel free to get in touch.

How Hotjar Can Help You Convert More Leads

Hotjar is a great complement to Google Analytics. Layering qualitative and visual data over the raw numbers gives you another dimension of insights.

But just like with your Google Analytics data, if you ignore key segments, you do so at your own risk.

Imagine, for example, that a heat map shows you that only 20 out of every 1,000 of visitors click on your Product Tour CTA. In fact, the scroll map shows you that only 15% of visitors even reach that section of the page.

You might conclude that the section and CTA don’t matter, and consider removing them.

Now imagine that all 20 of those visitors are leads – visitors who have identified themselves by signing up for a free trial, downloading a resource, or attending a webinar. Suppose that on average 15 of those 20 leads end up turning into opportunities. The Product Tour just went from wasted space to one of the highest-value interactions on the site!

Fortunately, it just takes a bit of work to begin segmenting your most valuable visitor data in Hotjar. Let’s look at how to do this with leads.

Why leads?

While leads might not be your most important identifiable visitor segment, for most B2B SaaS sites they deserve special attention. In fact, they’re already getting special treatment in your nurture campaigns. (Right?) And hopefully you’re personalizing offers and CTAs for them as well.

Still, the steps below will work for any segment you can identify. Target accounts, industry of interest, or existing customers can all be given VIP status in Hotjar.

Setup

Before you begin, make sure you have two things in place.

1. Hotjar Plus or Business

The free plan doesn’t support custom tags and triggers.

2. A way to identify leads on your website

Not sure how to do that? This post will walk you through it. And if you’re using Marketo, FunnelEnvy automatically syncs lead status with all your frontend tools – Google Analytics, Drift, Google Optimize, and yes, Hotjar.

Tag session recordings

Watching playback of visitor sessions is a great way to put yourself in your customer’s shoes. It’s also dauntingly time consuming. One day’s worth of recordings could take a month to view.

So clearly you need to prioritize what you focus on. Watching a half dozen leads interact with your website will yield more insight than watching a hundred anonymous visitors land, scroll, and bounce.

All you need to do is execute a single line of code when you identify a lead on the site:

hj('tagRecording', ['leads']);

Set this up, and you’ll be able to filter recordings later.

Screenshot of Hotjar recordings filtered for leads

(See the Hotjar docs for more detail on how this works.)

Trigger heat maps

Instead of mixing clicks from anonymous visitors, customers, and leads all into a single heat map, you can create one for leads only.

You’ll need to create a heat map with a JavaScript trigger, then fire the trigger when leads visit the page in question.

If you’re using FunnelEnvy for Marketo, it’s as easy as adding a Trigger to Google Tag Manager:

Screenshot of a Trigger in Google Tag Manager

(FunnelEnvy for Marketo can push visitor stage to the Data Layer, meaning you can use it to trigger any Tag)

Then create a Custom HTML Tag to fire the Hotjar code:

Screenshot of a Custom HTML Tag in Google Tag Manager

Create a custom poll for leads only

What page has the highest exit rate? What page do visitors spend the most time on? What are they looking for, and not finding?

The answer is probably different for leads compared with anonymous visitors. The only way to find out is to ask.

Lucky for you, you can trigger a custom poll with the same code that triggers custom heat maps.

So if you’ve added the Google Tag Manager logic shown above, all you have do to is create a poll with a JavaScript trigger. And you’re done!

Screenshot of a Hotjar poll

Ask every visitor this question, get a lot of noise. Ask leads only, find out what matters

Where to start

There’s a lot you can do to better understand (and more effectively convert) leads on your website. As a first step, just tag and watch some session recordings to see how leads navigate your site.

This requires a way to identify those leads in the first place. Solve that problem once, though, and you open up deeper insights in Google Analytics, custom playbooks in Drift, and personalization options in Google Optimize.

If you’re using Marketo, FunnelEnvy solves this for you. No need to bring in the dev team and turn it into a multi-month project. If you’re ready to start giving leads the special treatment they deserve, just get in touch.

By |2020-08-03T11:54:09-07:00July 13th, 2020|Analytics, Strategy, SaaS, B2B|0 Comments

Real-Time Personalization with Segment and FunnelEnvy

Segment is a very popular CDP (customer data platform) that specializes in unifying data sources in real-time across your digital touchpoints and with your ever growing marketing technology stack.

Segment is an especially popular choice with product and engineering teams because it can serve as the organization’s centralized hub for data collection, integration, and syndication. And what really makes Segment so powerful is its 300+ API integrations with top marketing technology platforms.

This has resulted in Segment becoming the foundational data platform for thousands of organizations that now use this unified data to power a variety of business use cases throughout their entire marketing stack and across their digital touchpoints.

Today we are going to do a deep dive on delivering site personalization using Segment data. This can be accomplished through the FunnelEnvy’s Segment integration which makes it easy for Segment customers to test, target, and personalize user journeys using all of that rich user and event data in real-time.

Activating Segment Data with FunnelEnvy

Segment is one of the out of the box integrations that come with the FunnelEnvy Platform.

The first step to activate the integration is to select Segment as a Data Source within the FunnelEnvy Platform.

Next, copy the API Key displayed in the integration details, check the “Active” checkbox and save the integration.

The Segment integration will be listed as active and FunnelEnvy will now start tracking identify calls and associated traits from Segment.

The last step is to configure FunnelEnvy as a new Destination within the Segment Platform. In Segment search for and add FunnelEnvy as a destination.

In the settings you’ll need to add the API key that you copied from the FunnelEnvy platform when you activated Segment integration.

Save the destination and you’re done. Identify calls and track events and associated traits/properties will start flowing from Segment to FunnelEnvy.

That’s it! The FunnelEnvy and Segment integration is now ready to go. If you want to also set up FunnelEnvy as a data source for Segment (Segment as a FunnelEnvy destination) you can follow the steps outlined at the bottom of this help guide. This step is useful for syncing FunnelEnvy audiences with Segment and tracking which FunnelEnvy campaigns and experiences a user is associated with.

Now that we are up and running and sending our Segment data to FunnelEnvy, let’s explore a few popular personalization use cases.

Popular Personalization Use Cases With Segment Data

The most exciting use cases with using Segment data for personalization is the ability to deliver targeted 1:1 experiences based on the user’s relationship with you and serving the most relevant offers for them.

The exciting promise of CDP’s like Segment is they contain your best data view of your users and customers. Now by integrating Segment with FunnelEnvy we can target your users in a more personalized way and present them the best offers and experiences to drive better business outcomes.

Let’s look at how to set up a few of these personalization use cases in FunnelEnvy.

Personalizing for Existing Customers

The majority of websites are static and prioritize the site experience for that new visitor or prospect. This is the right strategy for growth but it results in a suboptimal user experience for our most valuable audience, existing users and customers.

Common sense tells you that if you can, you should personalize the site experience for your existing customers that may be coming back to your site frequently to login and use your products and services.

In this client example, we have a SaaS business where users must login to the website to access their services. Because this client tracks active logins in Segment we can easily personalize the site for this user audience.

Once the Segment integration is activated you can create new conditions, audiences, or goals based on any combination of Segment data. To begin, just create a new condition and select Segment as your data source.

In the below screenshot we will create a new condition in FunnelEnvy based on the user being an active user based on Segment data. In the drop down I can pick from any and all Segment data being passed to the FunnelEnvy Platform. In this case, I select the “Is Active User?” attribute and specify it must be true.

Once created, this new condition can be used to build targeted audiences that I can then use to personalize content to existing customers. My newly created Active User audience can now be easily applied to any of our A/B, predictive, and rules based campaigns, like in this example below:

I can now target active users with personalized customer content the next time they return to my website to login.

We can create simple audiences like in the example above or we can create more advanced audiences that combine multiple attributes from Segment and other data sources. In this example below, I am creating an audience based on the user being an active user AND has viewed our resource content section based on their onsite browsing behavior.

And the best part is that I can set the audience to automatically sync with Segment as one of FunnelEnvy’s data source destinations.

Use Next Best Offers to Convert More Prospects into Customers

Another great use case with personalization is the idea of serving your prospects the next best offer based on where they are in their buyer journey and based on what offers they have already activated.

While this is a very straightforward campaign in your email nurture campaigns, it’s often hard to execute on your website in real-time. Because of this challenge, most sites continue to show the same offer over and over again to prospects even if they already signed up for that offer. The end result is another missed opportunity to provide a more engaging experience to another high value audience, active prospects.

Luckily, this challenge is easily solved, and is just another straightforward site personalization use case when you pair Segment data with the FunnelEnvy Platform.

For this client, a product demo is the most popular entry offer for new prospects, but once they watch a demo there are a number of other offers that can help move the deal forward. They have webinars, calculators, and case studies that all work well as offers in the middle and bottom of the buyer journey.

In this example below we want to target active prospects who have completed a demo. Our client tracks in Segment which users complete a demo based on a Registered for Demo attribute. That allows us to easily create conditions and audiences based on the user being in the demo stage, like in the condition screen below.

With a few clicks we have created an audience of all site visitors that have completed a demo. We can now target our homepage banner to run a personalization campaign that will predict the next best offer for that active prospect from a collection of their top offers.

This is another example where instead of presenting an irrelevant offer, we can provide a more relevant experience and personalize the next best offer for our valuable active prospect audience.

Make Better Real-time Personalization and Attribution Decisions

The first two personalization use cases I shared focused on creating very specific audiences based on user stage data coming from Segment. Our last use case is focused on leveraging all of that rich Segment data to make better personalization decisions and to measure the attribution impact on revenue.

If your Segment implementation is typical of most of our clients, you likely have dozens if not hundreds of data attributes about your users coming from your customer databases, transaction systems, and various other marketing platforms. Typically, Segment has the richest and most accurate real-time data profile for your users, especially when it comes to revenue data.

For example, did that trial user successfully convert into a paid user 30 days later and generate revenue? How much revenue has that user generated over their customer lifetime?

Going back to our previous SaaS client example, they have a service that you typically start as a trial, and they can generate revenue from that user from both a monthly subscription fee and from specific actions they take in their account. In this case, the client tracks all revenue activities for a user with a Segment event named Generated Revenue.

Because all Generated Revenue for a user is tracked within Segment we can easily build a goal in the FunnelEnvy platform that will update whenever that Segment event fires and populate with the actual revenue generated from that event.

Since Segment track events become FunnelEnvy events, they can be used for goal tracking like any other event in our platform.

In the example below, we are setting up a new goal in FunnelEnvy that fires each time the Segment track event named Generated Revenue fires.

In real-time, every time that Segment track event fires we are now tracking that revenue and associating it back to the user and personalized experience they saw.

With this data flowing back to use in real-time we can now unlock two powerful capabilities.

Predicting Better Experiences to Maximize Revenue

Because we can track the total revenue a user has generated we can now start using that data to predict which personalized experience generates the most revenue for the business, not just the most trials or initial orders.

The FunnelEnvy personalization platform uses machine learning to predict which experience will perform best for an individual based on that user’s profile and on the history of how similar users converted on those same experiences.

This allows us to take advantage of all the data we have as the FunnelEnvy platform will predict and promote those experiences that maximize generated revenue for each user.

So in this case Segment data helps us convert more visitors to higher revenue generating experiences, all without the manual hassle of pre-defining segments or personalization rules. We let machine learning crunch all the data and predict the best experience for each user, all in real-time.

Better Attribute Incremental Revenue to Personalization

While generating more revenue is always priority one, as marketers we also need to demonstrate that our programs and campaigns are working and providing strong ROI.

In our example with the Generated Revenue event, in addition to making better predictions, we can also clearly demonstrate the impact on the revenue we are creating through our personalization initiatives.

With our integration with Segment, we are able to credit and report on how much revenue our personalization activities are generating and which personalization experiences covert best. We can then show incremental revenue by running a controlled A/B test that serves half the audience the control experience and the other half the predicted experiences. We then measure the difference between the two groups and report on uplift in conversion and value per visitor and calculate statistical significance.

With the Segment integration, it is now much easier to measure and demonstrate the incremental value of personalization. Not just on the initial order, lead, or trial but on customer lifetime value (CLTV).

This can all be done in real-time right out of the FunnelEnvy Reporting UI without any ongoing support from your IT or data team and without having to wait for delayed manual reporting.

As a marketer, you can finally focus on optimizing your personalization strategy without all the data and operational headaches. Wouldn’t that be nice.

Getting Started

As you can see, integrating Segment data into your personalization program is very straightforward and can unlock some very valuable capabilities and use cases.

If you’re not yet using FunnelEnvy but are interested in personalizing your website using Segment data we’d love to hear from you! You can contact us here: https://www.funnelenvy.com/contact/

10 Tips for Running Effective Predictive Personalization Campaigns

When it comes to personalization there is a growing trend with using machine learning to predict and optimize for the user experience at a 1:1 level.

We call the collective use of these machine learning techniques as predictive personalization campaigns.

Predictive personalization refers to a type of campaign where a machine learning model is used to predict what is the best experience to serve a visitor based on current/historical performance and the user’s individual data profile (contextual bandit). Decisions are made in real-time and at a 1:1 level and the model makes use of all the data available about that user and also takes in the context about the location, content, and other factors that go into that experience.

The predictive campaign will send the majority of traffic to the experiences that the model predicts will perform best, exploiting those insights in real-time, but continue to hold out some traffic to continue learning and exploring performance trends for the other experiences.

Just like with an A/B test, you can test predicted campaigns vs. a control to determine if a statistically significant uplift is achieved. But unlike an A/B test, the expectation with predictive campaigns is that it is “always on” and that it’s constantly adjusting traffic to the right experience at a 1:1 level.

The adoption of predictive personalization campaigns is still in its early days for our industry. For many programs, experience and maturity with these techniques are still low but there is a growing interest, especially as the solutions on the market continue to grow.

In this article we discuss best practices we have acquired from years of running predictive campaigns across a range of mid-market and enterprise clients using the FunnelEnvy platform.

What Makes For More Effective Predictive Personalization Campaigns

Below is a list of our observations after running hundreds of personalization campaigns over the years on the optimal conditions that contribute to successful predictive personalization campaigns.

  1. A variety of user intent. With a predictive campaign the more varied in intent and behavior that exists with users the more valuable predictive models will be in detecting and predicting better user experiences. The more varied the signal the more value predictive decisions can play a role in deciding and predicting the best outcome for a range of user intentions.

A good example of this is with predictive campaigns on the homepage, where user intent typically varies across the board.

  1. A variety of goals to predict for. A variety of possible user outcomes to predict for is another valuable ingredient for a successful predictive campaign. Like with user intent, we want to capitalize on the strengths of predictive models, and the more varied outcomes to predict for usually results in better business outcomes.

Good example of this is with a campaign that rotates a variety of goals or user journeys as the primary offer and call to action (CTA). Like in B2B, where you may have 4-5 different offers like free trial, request demo, request pricing, book a Drift meeting, download whitepaper, or register for a webinar. Having multiple offers to present or predict usually results in better performance of the predictive models.

  1. A variety of goal values to predict for. Multiple goals are a good thing, and having multiple goals with different values is even more helpful to your predictive campaigns. Once again we are seeking out scenarios where we have multiple goal options, all with a range of perceived value. This becomes important because we want to give the model more detailed feedback on what is working and what is more valuable to the business. If like in the previous example, you had 5-6 B2B goals but all of them were valued the same, (say $100 per goal completion), all goals would be perceived as equal, providing less signal back to the model. However, if your goals vary widely in range from $50 to $1000 per lead, then the predictive model has far more data and data points to work with.

An example of goal variety we typically see with SaaS clients is that goal values will fall into 2 tiers, lower value content engagement goals (content download, webinars, video views), and higher value sales intent goals (request demo, request pricing, contact sales, free trial).

  1. Goals are aligned to business revenue. While goals can vary widely, it is important that your goals are either revenue goals or events that correlate closely with revenue. Ultimately, predictive campaigns do best when they predict which experience is the most valuable.Therefore it’s important that you set up your campaigns to predict high value outcomes like purchases, trial to paid conversions, MQL/SQL, and closed/won deals. Where possible avoid micro-conversion and vanity metrics as your primary KPIs whenever possible. Examples of vanity metrics would be clicks, page views, video plays, etc. Whenever your KPIs are not tied to revenue/business value the harder it will be to have predictive campaigns be effective for you.
  2. There is some version of a revenue journey that you can track and optimize for. The more diverse and complex your buyer journey is the more you will benefit from using a predictive campaign that can take in all the data and outcomes and predict for better outcomes for your users.

If anyone has the same exact journey, there is less to predict for. However, if your a typical SaaS business and you have a variety of SMB to enterprise offerings, and you offer self service and enterprise sales scenarios, or you have a longer sales funnel that includes MQLs/SQLs/Opportunity Stages, then identifying the valuable trends across multiple goals in that revenue journey is a specific challenge that machine learning models do better at predicting for.

  1. Testing of high impact placements on the page. This recommendation is not unique to predictive campaigns and holds true for all types of campaigns, including A/B tests. If you are going to run a predictive campaign, you need to run it in a high impact location for it to be most effective.So examples of good placements would be primary offer/CTA on page sections above the fold. We have seen predictive campaigns run on small content strips or on content sections below the fold, and while they may contribute value, it’s just not going to generate a significant impact compared to continually optimizing for the high impact locations.
  2. Higher volume of traffic and conversions. Another no brainer but worth calling out. You want to run campaigns on highly trafficked pages that correlate well to conversions and revenue (think product and pricing pages vs. community or blog pages).

You should be prioritizing opportunities where you can move the needle and truly impact revenue for your site.

  1. More available data attributes for predictions. Predictive models need data to provide relevant signals. In many of the above recommendations I call out that the more variety of intent and goal outcomes, the more data points the model has to work with for its predictions. The objective here is to generate more contextually relevant data attributes that can feed into the model. The strategy here is to instrument more meaningful data events and attributes to feed the predictive model, often referred to as feature engineering.

Examples here would be setting up more targeted audience segments (flagging prospects and customers for example), or integrating a new data source like a firmographics API from Demandbase or Clearbit, or integrating with your CDP, CRM or Marketing automation platform, or defining content and product affinities based on user behavior and pages visited. In each of these examples we are feeding additional relevant data around user intent, behavior, or data we have about our users. All of which can help a model identify additional experience/user matches that correlate better to revenue.

  1. Stakeholders understand and appreciate the differences between A/B testing and predictive campaigns. This is an organizational consideration, but when you run predictive campaigns, there are certain differences that you and the larger organization needs to be aware of and comfortable with. Unlike an A/B test, your experiences may not be sticky to a user over the life of the campaign (optional). Secondly, predictive campaigns are designed to maximize revenue, you may not have a clear winner or a straightforward outcome or winner after running the campaign. In predictive campaigns there is often no one winner. You find that different experiences perform better for different user segments. Some organizations are very comfortable with this reality, others struggle and prefer the simpler situations and outcomes that come with traditional A/B tests where you have a clear learning and you can full scale a single winner for the entire population.This is where you need to educate your organization on the pros and cons of running predictive campaigns.
  2. Stakeholders value and are responsible for revenue. While everyone in the company will say they value revenue, not everyone is responsible for generating revenue on behalf of your business. And that is ok. But, when it comes to predictive campaigns the best outcomes are usually achieved when the primary stakeholder is aligned to revenue targets and takes the responsibility to grow those revenues as best they can with proactive initiatives like site personalization. This is where we often see the most success with our clients. Being motivated by revenue vs. just learnings, will result in a more focused approach to revenue optimization, and in many cases a predictive campaign is more effective than an A/B test in maximizing revenue for your site and user experience.

Please keep in mind that while these are 10 preferred conditions we believe improve the likelihood of your predictive campaigns being successful, this full list should not serve a prerequisite or requirements before you launch your first or next predictive campaign. Typically, if you can align on 2-3 of these conditions you are often in good shape to see success.

The goal of this list was to share with you lessons learned and what to look out for as you continue to grow and expand your personalization programs and are ideally incorporating predictive campaigns more often into your portfolio of marketing and personalization initiatives

Getting Started

Now that you know what to look out for when designing and prioritizing your predictive campaigns, let us know how we can help you maximize your personalization initiatives.

We’d love to hear from you! You can contact us here: https://www.funnelenvy.com/contact/

When to A/B Test and When to Use Predictive Bandits

For the majority of marketers, when you talk about CRO and optimization programs, people immediately jump to A/B testing and assume that is the primary tactic and is the only tactic to demonstrate success for their programs and initiatives.

While A/B testing is a critical tool in your optimization program it shouldn’t be the only option on the table. While A/B testing is a valuable solution it is not a one size fits all solution for all your business challenges.

With advances in new data capabilities, marketing technologies, and real-time computing power in recent years, there are now more ways to solve for the same optimization problem.

For this discussion, we want to focus on two different techniques.

A/B test – A controlled experiment where traffic is split across 2 or more experiences and visitors are randomly assigned an experience and they stay in that experience for the duration of the test. At the end of the test, you determine a single winner based on which experience generated the best outcome for your primary KPI based on a predefined sample size/test duration and ideally reaching a specific statistically significant threshold. You then stop the test and full-scale the single winner for all traffic either directly in the testing platform or hard-coded into your CMS/platform.

Predictive Bandit – An experiment where traffic splits are not equal and where visitors are not randomly assigned. In these campaigns, a machine learning model predicts what is the best experience to serve a user either based on current + historical performance (multi-arm bandit) or based on current/historical performance + the user’s profile (contextual bandit). Like an A/B test, you can run the predicted experience vs. control to determine if a statistically significant uplift is achieved. But unlike an A/B test, the expectation with bandits is that it can run ongoing.

Now that we better understand the two techniques let’s explore reasons why both have a place in your optimization strategy.

Pros and Cons of A/B Tests

A/B testing is embraced in the analytics community as the smart and scientific way to measure the impact of change. Controlled experiments are used in testing the effectiveness of new medicines, academic/scientific studies, and of course in marketing. A/B testing is not new to marketing. It’s been done for decades in the direct mail/direct response world. And has become the recommended way to test changes on your website and mobile app assuming you can convince your stakeholders that testing is needed within your organization (it’s 2020 but still some organizations resist).

PROs:

  1. Quantify the impact of changes on your site. Don’t leave change to chance, measure and quantify the positive and negative impact of changes in experience with confidence.
  2. A/B tests are well understood in our industry. And for the most part well understood across an organization. Statistics may not be, but in general most folks understand the approach. In the end, if everything goes according to plan you have a clear outcome; either control won, or one of the challengers is declared the winner.
  3. Clear learnings. Related to the 2nd benefit of being well understood, benefits of an A/B testing is not just impact on business results, it’s shared learnings of what may or may not work for your site/business. With A/B tests you ideally gain a better understanding of your visitors and customers.
  4. At scale, you can create an organizational culture of experimentation. This change in culture leads to more creativity, risk taking, and better data driven decision making. Typically organizations that test more, make better and more informed decisions for their organization.

CONs:

  1. Success rates will vary, but are often low. Industry averages place the average success rate of A/B tests at 30-40%. So you have to expect that the majority of the time you are not going to end up with a new winner. Even within the winners, even fewer are high impact wins. The one hidden benefit to this, is that it makes the argument of why A/B testing is so important. If we didn’t test, the majority of the time those great ideas we think will perform better, actually perform worse or have no impact.
  2. One size fits all and the winner takes all. When you analyze your typical A/B test you will often see at a segment level, different groups convert very differently across the variants. At the end, you pick the variant that was best on average across all your traffic and full scale that one. But in doing so you do leave some money on the table, as the winner will not be the winner of all segments.
  3. Results can and do change over time. If you look at performance trends over the life of the test, it’s often the case where test results trend up and down over time. Guess what, that data reality continues to occur even after you hard code and full scale the winner. You can lock in the experience but you can’t lock in the results going forward. Results will continue to change, and a decent percentage of the time, as tests continue over time you experience a regression to the mean, where results start to flatten out. After all, if you run the same test twice, you will seldom get the same results. This is why, for many programs when you full scale that winner you usually don’t experience that lift ongoing. It still is a better way to make decisions, but as we know audiences and behaviors change. Seasonality can also be a factor.
  4. You sacrifice business value for concrete learnings. By design, an A/B test is designed first and foremost to generate a solid learning. Usually you are willing to sacrifice short term uplift if a variant does better than the rest, and willing to suffer through some short term downside if a variant clearly underperforms. You are willing to accept a sub optimal impact on revenue during the duration of the test because you are prioritizing a clear test result for short term business benefits.
  5. You need traffic. Not every organization can run A/B tests. Sufficient traffic and conversions are required to reach a statistically significant outcome. Not all sites have that, especially in B2B for example.
  6. Operational costs can run high. From selecting a testing platform, bringing on web developers, additional creative, and data analysis, the tool and people costs can be meaningful. Plus, there are the operational costs of introducing more time and resources to launch something, and the occasional negative costs from broken experiences or flawed tests. All marketing teams and programs incur people, tools, and operational costs, and testing is no different and often carries more cost overhead.

While I go into more detail on the cons with A/B tests, I do some because some of the cons are less understood. Still, when done right, A/B test is worth the effort and the benefits will far outweigh the cons.

But as I hopefully outlined above, A/B tests do have different strengths and weaknesses.

Pros and Cons of Predictive Bandits

Bandits have gained more popularity in marketing in recent years as computing power has advanced to the point where real-time machine learning predictions can be applied in more and more marketing technologies and for more use cases.

We have seen the trend emerge in digital advertising where bid and creative recommendations are often driven by machine learning decisions.

However, when it comes to site optimization the adoption and acceptance of bandits as a proven technique is still in the early days. For many programs, experience and maturity with these techniques are still low. Even though some of the most popular testing platforms have included those capabilities for a number of years. Let’s discuss why.

PROs:

  1. Bandits are by design biased toward business outcomes. Unlike A/B tests which are designed to maximize time to a clear learning. Bandits are typically designed to maximize the business outcomes at the expense of clear and precise learnings. The algorithms typically send more traffic to experiences that perform best, and route traffic away from experiences that underperform as a whole or for a specific audience segment.
  2. Bandits use all the data to your business advantage. In A/B tests you may use data to inform and drive your test hypothesis, but when it comes time to setup your test, you typically set it a controlled randomized experiment where traffic is split evenly and your visitors are randomly assigned to one of the variants during the duration of the test. Again, this is absolutely the right way to run a controlled experiment to generate your best chance at a concrete learning. However, this also means you are ignoring the data and trends that live within a test and the micro trends of which traits and segments perform best for each variant. With Bandits, machine learning is consuming and using all available data on the variant performance and the user to determine the best possible user experience for that user to drive the optimal business outcome. It’s far from perfect, but you are not leaving the outcome to chance. You are using all the data you know about the user and situation to make the experience decision to maximize your business outcomes.
  3. Bandits adjust to changing trends and behaviors. With Bandits, the intention is for it to be always on and constantly adjusting to the latest performance trends of the campaign. Unlike an A/B test where you pick one winner and lock it in, a Bandit can adjust as results change over time, and minimize any loss in performance and capitalize on any shifts in winning experiences.
  4. Bandits can work with less traffic. Because you are optimizing for revenue instead of learnings, you can still benefit from bandits even though you have less than optimal traffic to run a clean test.
  5. Bandits work well in time sensitive situations. Popular content and Black Friday sales are good examples. By the time an A/B test gives you the right answer the opportunity may have passed you by. With Bandits, it reacts in real-time to the trends and that allows you to take advantage of short term and seasonable situations.

CONs:

  1. Bandits are hard to interpret, understand and communicate. While A/B tests are well understood, bandits are not. The fact that decisions are controlled in real-time by a machine learning model vs. set A/B splits, means users do not have certainty about why an experience was shown or control over the traffic rotation.
  2. Bandits offer limited learnings. A/B tests by their design as controlled experiments are designed to produce learnings. Bandits will typically sacrifice clarity of learnings when it comes to which experience works best. You can often be informed about what segment or what feature influenced the bandit model decision, but it’s not as clear cut on what is the final absolute winner. Often you are A/B testing the technique, do bandits outperform control or an A/B test for this page/site. But with bandits it’s harder to generate clear learnings on winning experiences. In the end you are optimizing for revenue and other business outcomes at the expense of a clear isolated learning. As an organization you need to be aware and accept this reality and your stakeholders need to accept this reality too.
  3. Bandits can provide an inconsistent user experience. As we called out earlier, to maximize business outcomes, bandits by design do not make experiences sticky to the user, and will often serve a different experience to the same user if the data suggests it will result in a better outcome. While this maximizes revenue, it can lead to experiences being more dynamic and changing for a given user. While dynamic websites are generally considered a positive, because it is not very common in 2020 (surprisingly), this dynamic approach to site experience can be a drawback for some users.
  4. Bandits require more thoughtfulness on experience design. While you can A/B test most things from layout, to copy, to color, to offers, the same isn’t always true for predictive bandits. Bandits work best where you have varied user intent and ideally varied offers and outcomes. Bandits are more effective if they can predict for more outcomes for a larger range of user intent. If you are running CTA color and size changes you are better off running a traditional A/B test. There is likely less signal in the data in terms of user preference of a button color/design and the results will likely hold true on average for most users. That is why bandits work better when intent varies across the visitors and potential offers displayed can also vary.

When to Use A/B Tests and When to Use Predictive Bandits

Now that you know the PROs and Cons for A/B tests and predictive bandits let’s talk about some practical applications of each and when you should one over the other.

When A/B Tests are Recommended

  1. When you need a clear learning and more certainty on the final decision. Examples here would be a pricing or homepage test.
  2. When you want to lock in a specific design or experience for all. Examples here are things like a new homepage design, a new form layout, or say our site wide CTA treatments. Here there is more operational value in locking in that specific winner and then optimizing further on that.
  3. When intent and offer options are narrow in scope. When intent for all users is similar the offer is the same for all, then A/B testing usually works better than predictive bandits. An example would be optimizing for the final cart checkout page. Everyone there is ordering (or not) and the offer is a checkout (or not).

When Predictive Bandits are Recommended

  1. When you want to maximize revenue. If you have aggressive revenue goals then bandits are a better tactic to get you there as you are using all the data available to make the optimal revenue decision. A good example here is presenting the right offer on a homepage hero or promoting a specific price/package on the pricing page. In those situations, the general site is the same but you are predicting the best offer and experience to spotlight to maximize revenue.
  2. When intent and offer options vary broadly. Predictions work better when there’s a wider range of users and intent and a wider range of offers and outcomes to present. This is where the value of machine learning and crunching dozens and hundreds of data attributes in real-time is helpful. Good examples here can be homepage, brand landing pages, and pricing/plan pages. In these scenarios intent and options/offers presented can vary.

Now that you know the strengths and benefits of both tactics I think you will agree that both tactics should be part of your optimization and personalization toolkit.

Running A/B Testing and Predictive Campaigns in FunnelEnvy

With the FunnelEnvy platform we give you the ability to run both A/B and predictive campaigns and apply the right tool for the job. Unlike other platforms, both tactics are available as part of our standard license.

To get started you just create a new campaign and then select the preferred template option between Predictive and A/B testing.

If you selected an A/B testing then the “Campaign Decision” section will default the settings typical of an A/B test.

As you can see A/B testing is the decision type defaulted, and the “Persistence Variations Decisions” feature is checked so the same experience is served to the user across sessions. Lastly, you can adjust the traffic allocation to determine what percentage of traffic enters into the test. By default and typically it’s set to 100%.

If you were to select a Predictive campaign template, the decision type would instead default to Predictive as seen in the screen below.

In addition, the “Persist Variation Decisions” feature is not selected by default. As mentioned earlier, we typically see improved revenue performance when the campaign can rotate different offers over time to the same user. That makes sense, as a user may not respond to an initial offer, but maybe convert when presented another. But we do recognize their legitimate reasons to also make predictive decisions sticky, especially when running in locations like your pricing and plans page. And like with the A/B template, you also can set traffic allocation from 0-100%.

What is specific to Predictive campaigns is the predictive experiment options. Here you have two choices to make. The first choice is what percentage of traffic should be included in the predicted group vs holdback. The experiment section is where you can test the incremental value of a predictive campaign by holding back a portion of your traffic as the control.

In the screen below we have set the holdback to 50%. This will result in 50% of the traffic being assigned to the predictive experience and the remaining 50% gets served a control. This allows you to test the incremental value of running a predictive campaign on your site.

Typically, we recommend the client start a new campaign as a 50/50 campaign and as they see the predictive campaign outperform the control we then recommend full scaling the predictive campaign to 100%.

The second option you have with a predictive campaign is to determine the composition of your holdback group. You can choose between assigning the variation a specific variation, like baseline control, or you can set holdback to random in which case the holdback will run as an A/B test for that traffic across all the available variants. The “Random” option is useful if you want to determine the incremental uplift in running a predictive campaign vs. an A/B test.

As you can see, our predictive campaign setup still allows you to isolate and measure the incremental impact of a predictive bandit approach by running it as a controlled experiment.

Our typical client will often run both types of campaigns simultaneously on different areas of their site and targeted for different audiences. Rather than having to choose one tactic or another, FunnelEnvy clients have the best of both worlds.


Getting Started

As you can see, A/B testing and predictive bandits are both valuable tactics in your optimization/personalization programs. Like any tactic you need to pick the right tool for the job.

If you’re not yet using FunnelEnvy but are interested in personalizing your website using a combination of A/B tests and predictive campaigns we’d love to hear from you! You can contact us here: https://www.funnelenvy.com/contact/


How to Effectively Personalize your Website using Account Data for Anonymous Traffic

Unlike consumer marketers, B2B revenue teams often reason about their market at an organization or account level. That may be based on specific named accounts or company size, industry or other related firmographic attributes.

Much of the traffic coming to the website is of course, “anonymous” meaning that they haven’t shared any contact information. There are however a number of vendors that sell firmographic data that can deliver this information even for anonymous traffic. This is possible because every web request must contain the source IP address and these vendors have mapped many (though far from all!) of them to specific accounts.

Traditionally used for sales teams, some of these solutions can be integrated in real-time into the website. This opens up some interesting opportunities to improve the traditionally static experience – such highlighting industry specific offerings, enterprise plans, or even targeting customers of competitors and highlighting differences.

A word of caution is warranted here, however. This approach to personalization is an investment that goes beyond just the vendor costs and we’ve seen a lot of campaigns where the return did not materialize. So let’s go into the more effective use cases, selecting a vendor and how to integrate it into FunnelEnvy audiences and predictive campaigns.

Beware Vanity Experiences

Personalization over email is useful because it helps the recipient understand that it’s not a mass-emailing robot on the other end and that the message has been tailored to them. Website visitors have different expectations and what works over email can cross the line or be creepy on site.

Website personalization is most effective when it helps the customer by presenting them with an offer (next best action) that’s most relevant for them in their journey. That offer could be content, starting a free trial, contacting the sales team or whatever is both most relevant for them and maximizes their likelihood of conversion.

Although it may sound obvious, where we’ve seen campaigns underperform with reverse IP personalization is where it doesn’t meet these customer-centric goals. Consider the following:

  • Injecting the account name in the copy – Doesn’t the visitor already know where they work?
  • Crafting experiences based on visitor industry when there’s no industry specific features to the product or service.
  • Serving pages that are specific to individual named accounts. The volume is generally too low to make a difference and again the customer already knows where they work!

These sorts of experiences are self-serving and what we call Vanity Experiences.

Vanity experiences, including one on FunnelEnvy.com. It’s no coincidence that these companies also sell the products that let you do it!

On the other hand reducing friction and targeting a more relevant direct-response offer based on firmographic data can be very effective. In some cases you could even skip steps in the journey – such as eliminating the pricing page for enterprise visitors.

Firmographic Vendor Considerations

There is no vendor that will be able to match all of your traffic, in fact match rates are typically in the 10-30% range. A variety of factors can influence that, but probably the most important factor is who you’re selling to and the types of accounts that are visiting your site.

Large enterprises, universities and governments often secure well known blocks of IP addresses which are much easier to identify. On the other hand smaller businesses often use shared office space and Internet Service Providers (ISPs) which make identifying them much harder. If you’re primarily selling to small business it’s unlikely that you’ll match enough accounts for this to be a cost-effective strategy.

If however you do sell to larger organizations then even if you have a low overall match rate it could still be worth pursuing. The effective match rate for the larger accounts is likely to be much higher and most B2B companies generate from enterprise customers.

Aside from the match rate the actual performance (time to return a match response) is an important factor on the website. If the integration is too slow the page may render before you have an opportunity to personalize, making for a sub-optimal “content flicker” on the all important first page view.

Activating Reverse IP Data with FunnelEnvy

FunnelEnvy’s platform has out of the box support for three leading firmographic vendors – Clearbit, Demandbase and Kickfire. Once you’ve selected one of these vendors, integrating into the platform and using the data for segmentation (audiences) and directly within 1:1 predictive campaigns can be done in a few minutes and requires no IT involvement.

Data Source Setup

Each of these firmographic vendors is a Data Source in FunnelEnvy, and activating any one of them is as simple as going into the integrations, locating the appropriate data source and clicking on the activate checkbox.

Once activated and saved the data source will appear in the list of active integrations.

Since these data sources return data in the browser the FunnelEnvy javascript snippet must also be present along with the reverse IP vendor snippet. Data collection happens automatically without additional setup and can be used immediately for creating audiences and in predictive campaigns.

Audiences

In the Audiences section of FunnelEnvy you can create conditions based on the activated provider. The rule builder will include all of the individual data attributes from the provider and rules can be AND or OR’d together for flexibility.

As with any of our data sources conditions can be combined with other sources (behavioral, Marketo, etc) to create audiences defined from multiple data sources.

From the audience builder you may want to report on visitor behavior from a particular firmographic segment (e.g. SMB or Enterprise visitors). This can be accomplished within the audience through the Google Analytics integration by setting either a custom dimension and / or sending an event.

For personalization Audiences can be used within the targeting section of campaigns operating in both A/B/n or predictive mode. If an Audience is selected in the campaign targetings visitors must meet both the page and audience targeting conditions to be eligible to see a variation.

Even if you don’t create any audiences the underlying firmographic data is used in our real-time predictive campaigns.

1:1 Predictions with Firmographic Data

Firmographic data sets are excellent for our predictive campaigns because they’re generalizable and often highly correlated to experiences and outcomes. There are only so many audiences you’ll be able to create but every data point from these providers can be used by our algorithms to predict which experience is most effective on a 1:1 visitor basis.

You can see the effect of this in our campaign signal report which shows how strong the predictive signals are and how much they correlate to uplift and revenue. Individual firmographic attributes are often highly represented in successful campaigns.

A great example of this in action is a homepage campaign with different variations for the SMB or Enterprise journeys. Since reverse IP data is available even on the first page visit, our model can identify patterns in the visitor profile and serve more relevant experiences to your customers.

Getting Started

It is possible to improve upon static website experiences with reverse IP firmographic data and help your customers while at the same time increasing your conversion and revenue KPIs. If you’re a FunnelEnvy customer and want to explore firmographic personalization for anonymous traffic let us know.

If you need help selecting a vendor we can help with that too.  You can contact us here anytime: https://www.funnelenvy.com/contact/


Real-Time Personalization with Marketo and FunnelEnvy

For many organizations, Marketo serves as the real-time customer database for marketing. Unfortunately, for most organizations today this rich intelligence living in Marketo is not being leveraged to drive personalized user experiences across your site which is one of the most valuable opportunities with this data.

The good news is that when it comes to personalizing with Marketo, you don’t have to be limited to just personalizing your emails and Marketo forms. You can actually use all that valuable customer centric Marketo data to drive your website personalization programs.

Why might you want to do this? Instead of showing everyone the same lead capture experience, you could show prospects who have already filled it out more product content. Or show existing customers opportunities to expand. Maybe even segment your experiences and customer journey by company size or industry.

With FunnelEnvy’s Marketo integration you can use your rich Marketo data in real-time to deliver personalized experiences across your site.

Setting up the Marketo Integration in FunnelEnvy

Within the FunnelEnvy user interface you can activate and configure the Marketo integration. FunnelEnvy fetches Smart Lists periodically from Marketo and automatically keeps these updated with Marketo. Configuring the integration also lets you setup offsite goals triggered by Marketo webhooks such as Marketing Qualified Leads (MQLs).

The Data Filtering interface lets you choose which fields to import, and exclude PII or other data based on your compliance policies.

Typically these four steps are done by the Marketing Ops team that manages the Marketo instance:

  1. Activate the Marketo data source.
  2. Authorize FunnelEnvy to access Marketo
  3. (Optional) Configuring Data Filtering
  4. Selecting Smart Lists to Import

Step 1: Find and activate Marketo under the Integrations settings. You should see it as an activated Data Source.


Step 2: Authorize FunnelEnvy to access the Marketo REST API with API keys.

Step 3: Optionally configure data filtering rules. When fetching lists FunnelEnvy will only import lead attributes that are selected.

Step 4: Select Smart Lists for Import. Assuming your API credentials in Step 2 were correct, you should see a list of Smart Lists available for import. Note that it may take up to an hour for this list to reflect any recently added Smart Lists.

Once you’ve configured the Smart Lists for import you’re done! FunnelEnvy will refresh the lists every few hours, retrieving leads and refreshing the local copy of Marketo data, which is then available immediately for audiences, predictive campaigns and offline Marketo-triggered goals.

More details on setting up the integration can be found in our knowledge base article.

Using Marketo for Site Personalization in FunnelEnvy 

Once you’ve configured the Marketo Data source you open up a number of valuable personalization use cases. Below are three ways you can use FunnelEnvy and Marketo together to better target, personalize, and measure your personalization initiatives.

Target Experiences and Offers using Lead Attributes and  Smart Lists

Stop serving a static one size fits all website experience to all your visitors. Want to personalize your site experience only for prospects, or to specific accounts, or members of specific campaigns? 

With FunnelEnvy you can create very rich audiences that can be built off Marketo data and that can also be used as part of more advanced audience segments that combine Marketo data with firmographics and/or real-time user behavior as well.

In the condition builder interface you have access to all of the Marketo lead fields that were imported, and can define logical conditions based on them.

These conditions can also be combined with other data sources. In the audience screenshot below we’re combining a Marketo condition with a user’s behavior (but this could also be Demandbase, Clearbit or any of the sources we support). 

And just like any of the FunnelEnvy audiences, these can be used for targeting within predictive campaigns or A/B Tests:

This flexibility allows you to setup a dynamic “always on” personalization strategy that targets the right user segments in real-time based on that visitor’s stage and their relationship with you.

Personalize Experiences at a 1:1 Level with Marketo Data

While targeting is a powerful first step in executing your personalization strategy, the more powerful opportunity is to use all that rich user data to predict the best experience to serve each visitor. 

Choosing in real-time which experience to serve each user based on their full user profile truly allows for 1:1 marketing. That is where the personalization magic really happens.

FunnelEnvy uses machine learning to predict which experience will likely convert best based on all the data we see for that user, including their Marketo data and based on the history of how similar users converted over time.

And unlike A/B tests where a specific experience is randomly assigned, or rules based personalization where you fix a specific experience to an audience, FunnelEnvy allows you to take advantage of all the data you have on that user and serve the experience mostly likely to convert for that user.

This allows you to avoid the manual analytics effort of trying to identify and capitalize on all the possible experience and segment combinations that perform best. As a marketer you can stay focused on the message and offer and allow the algorithms to optimize the segment/experience matches.

As the report below shows, we are scoring/weighing the effectiveness of every attribute we see for every user by experience.

Here, Marketo audience data along with all the other behavioral and firmographics data is used to predict the best possible outcome for each and every user and experience combination.

This allows us to use all the data to our advantage and serve the right experience that will most likely result in revenue. 

The best part is that there’s no additional setup required here. Once we have the Marketo data within our profiles we’ll use it as long as the decision mode on your campaign is set to “Predictive”.

Measure and Attribute Personalization Campaigns by Revenue (not Form Fills)

With personalization, one of the bigger challenges is being able to measure the program’s contribution to revenue and business outcomes. 

It can be done, but often requires integrating data sets or pulling reports from multiple systems and generating manual reports after the fact.

WIth FunnelEnvy, once you set up your important online, MQL, and any other revenue goals you then start tracking and attributing success to each personalized experience. Below is an example where we created a MQL goal based on a Marketo List and assigned a specific MQL value to it.

To setup this, ensure that the Marketo Data Source is activated and configured and create a new individual goal. Under “API Triggering” you’ll should see an option for Marketo. Once selected, this is the URL that your Marketo instance will hit via a webhook to trigger the goal conversion. More details on setting up these webhooks is available in our knowledge base article.

Once that’s done the Marketo goal will shows in real-time in our campaign reporting dashboards.

It now becomes much easier to tell the story of how specific tests or personalized experiences are driving down funnel goals like MQLs, SQLs, opportunities, and deals won in addition to top level goals like trial signups, demo requests, or engagement.

This makes it much easier to attribute the positive impact personalization has on the organization’s revenue outcomes. Now instead of talking about form completes you can talk the language of sales which is revenue.

Getting Started

As you can see, integrating Marketo into your personalization program is very straightforward and can unlock some very valuable use cases and capabilities. The best part with this approach is that there is no custom development or IT involvement to get this up and running. You can setup the integration and be live with your first campaign on the same day.

If you’re not yet using FunnelEnvy but are interested in personalizing your website to Marketo Leads and Contacts we’d love to hear from you! You can contact us here: https://www.funnelenvy.com/contact/

Go to Top